Crash Analysis, ANR Analysis, Error Analysis
The usage of Crash Analysis, ANR Analysis, Error Analysis are relatively similar. Their usage will be introduced in the 1 Issue List and 2 Issue Detail sections of this chapter. Sections 3 Crash Analysis and 4 ANR Analysis will introduce the unique functions of crash analysis and ANR analysis.
1 Issue List
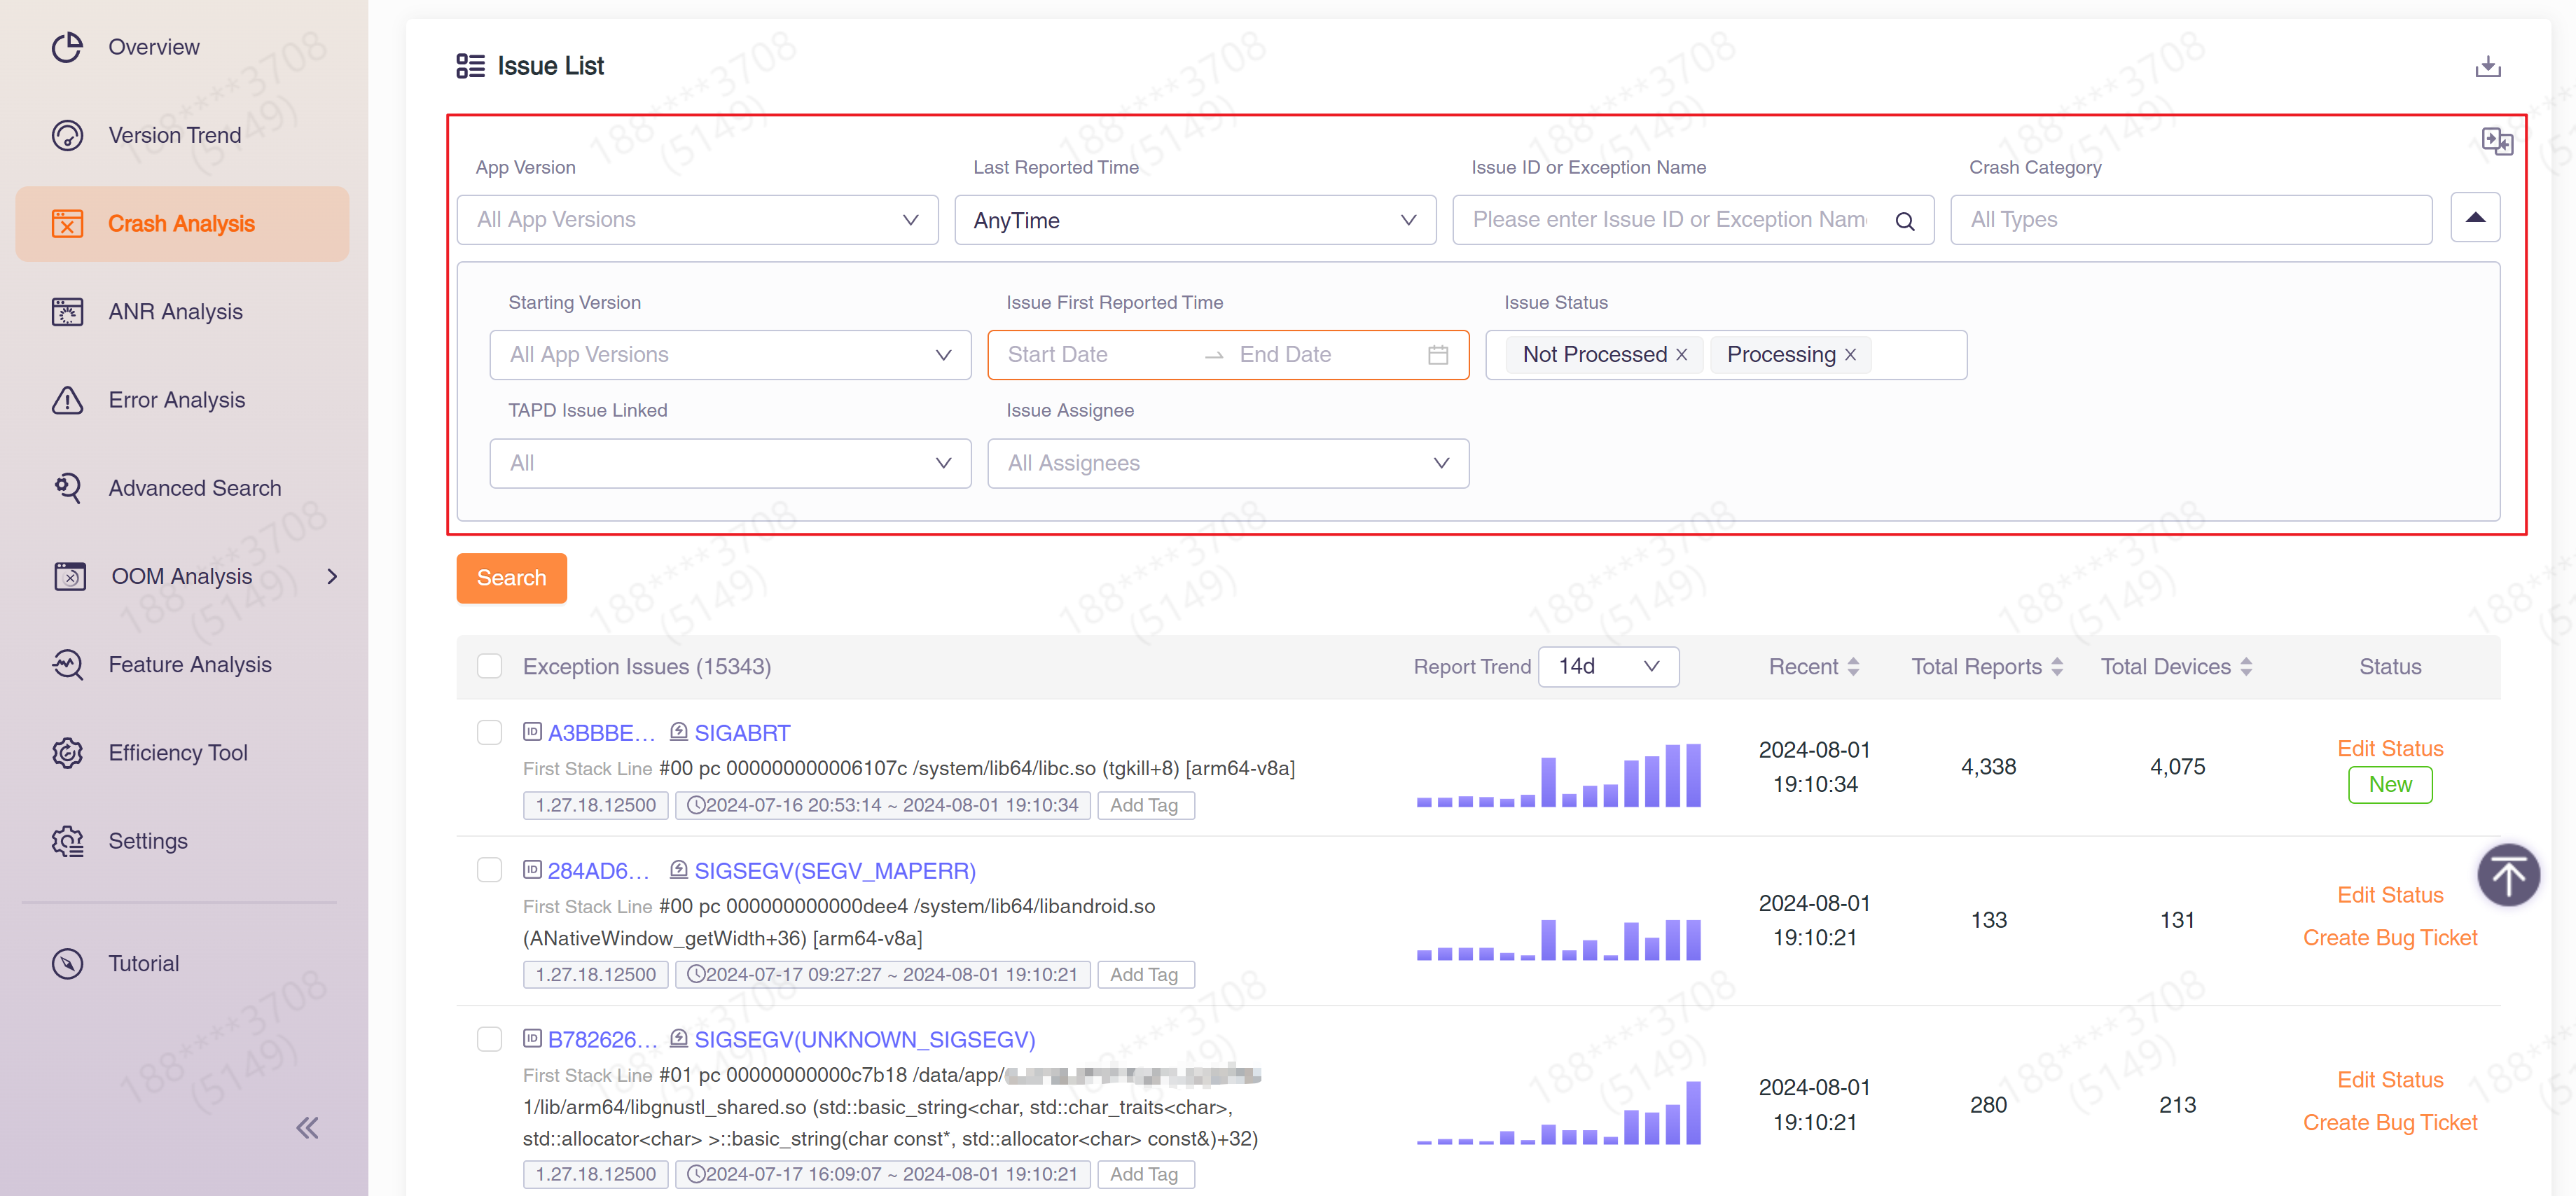
Select the "Crash Analysis"/"ANR Analysis"/"Error Analysis" tab to enter the corresponding issue list. The issue list lists all issues of this type. You can provide the input box at the top of the page to configure filtering. Available filtering items include version, last report time, issue status, Bug Form linked?, exception category, issue assignee, and starting version, issue first report time, and issue ID or error name. If these filter conditions do not meet your needs, you can click the "Advanced Search" link below to jump to the Advanced Search page to perform more complex filters.
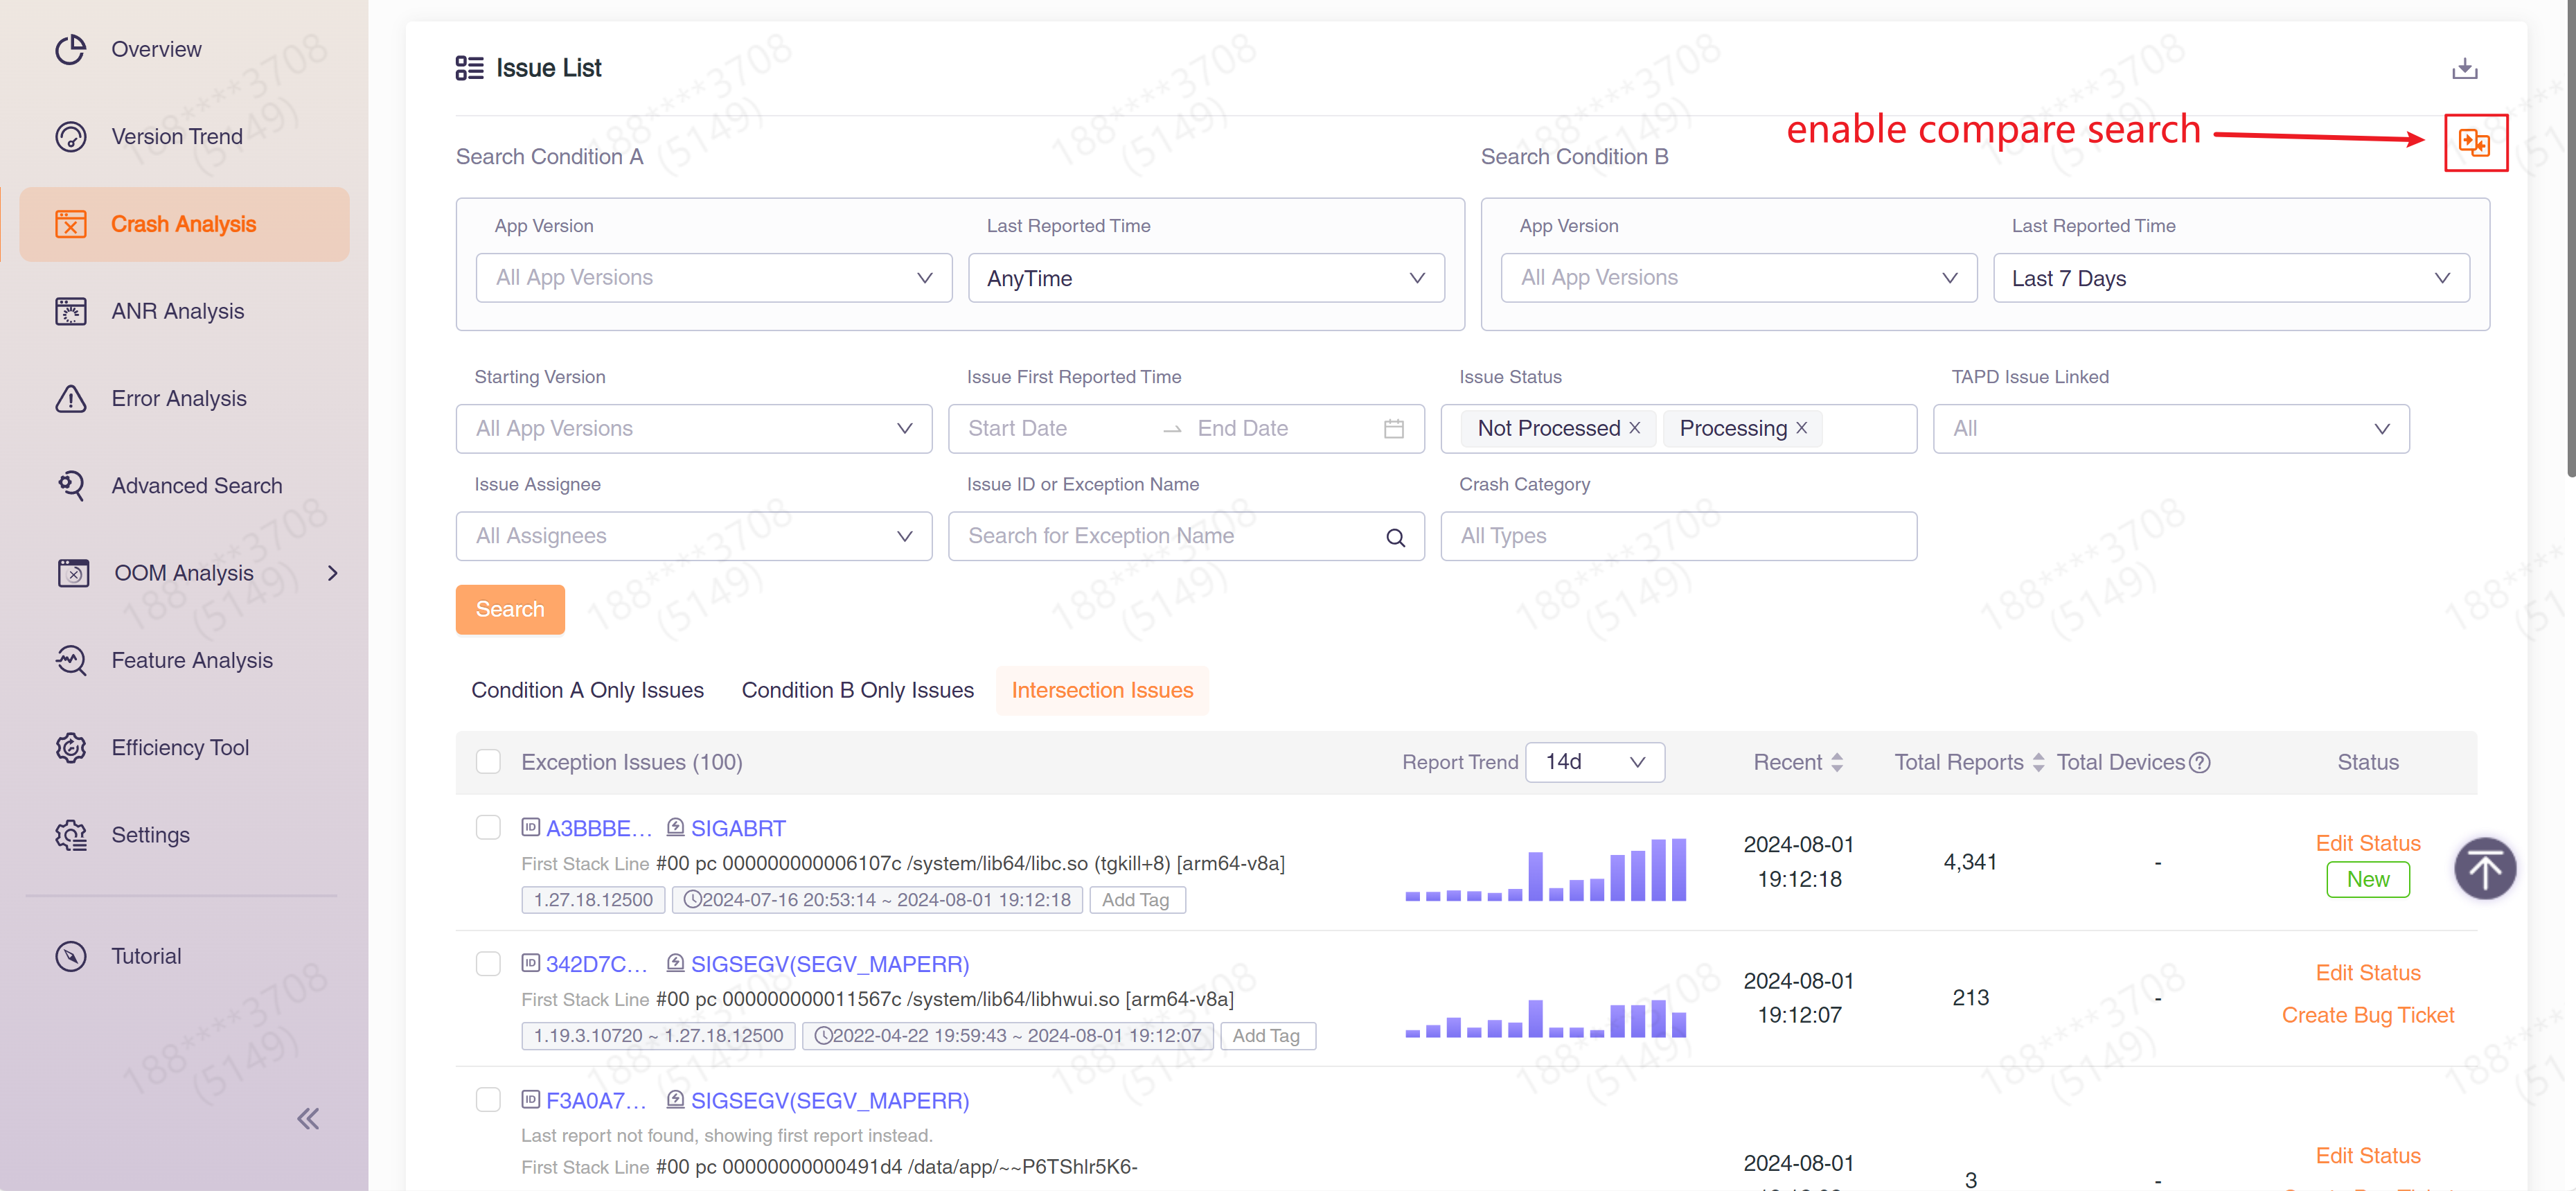
In addition, you can also check "Enable Compare Search" to delineate two filtering ranges and view their complements or intersections.
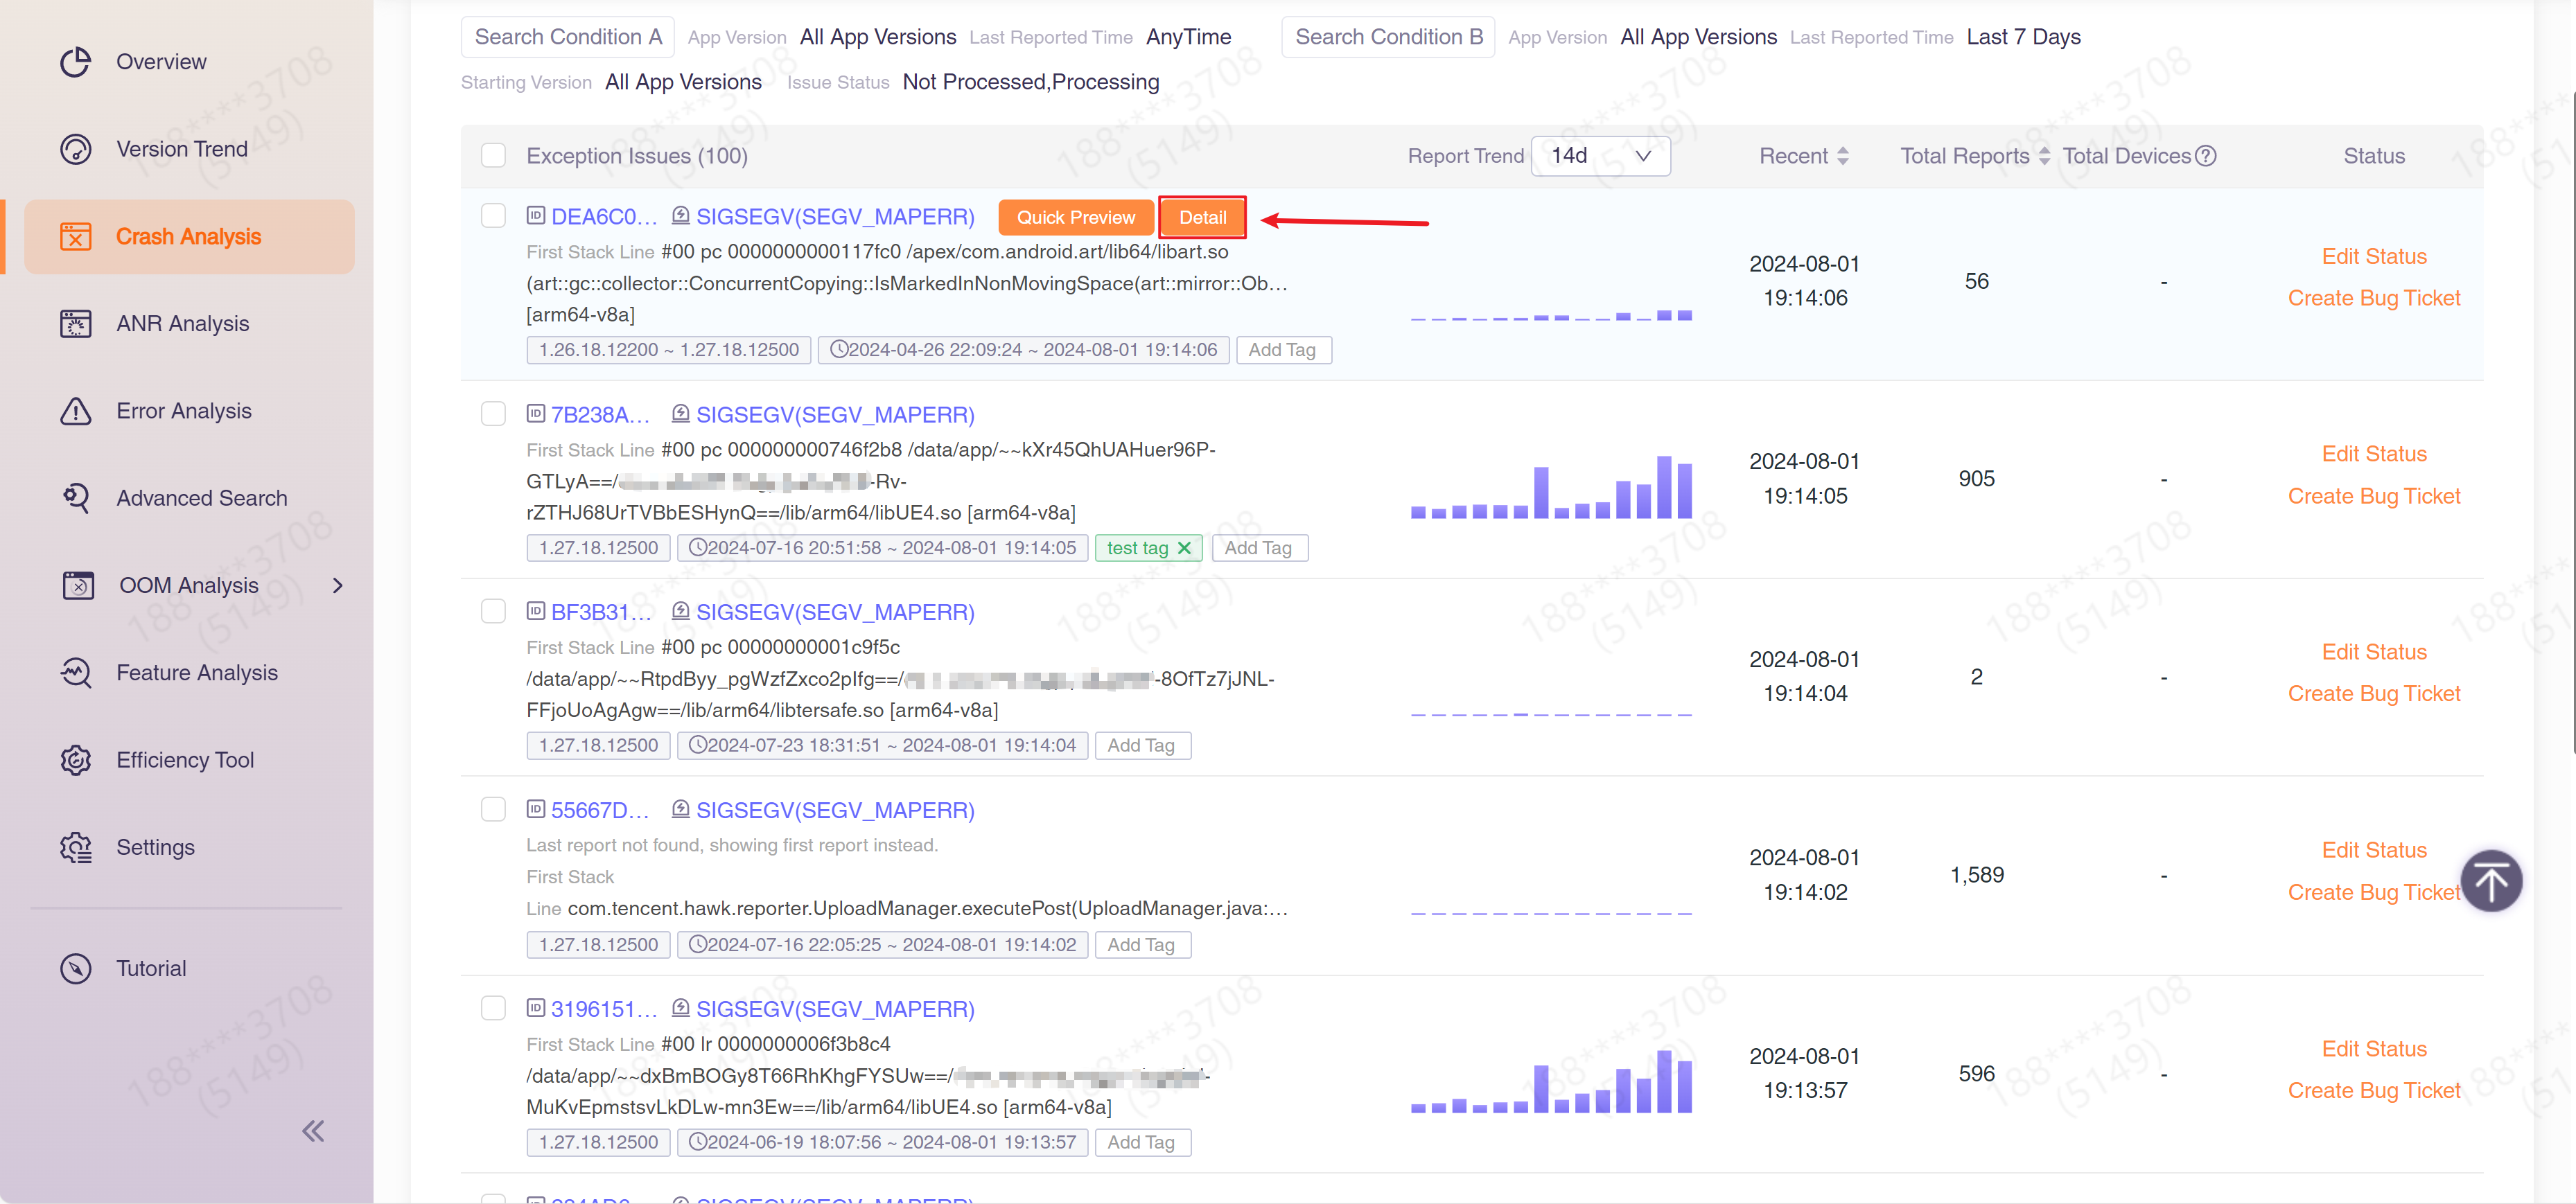
The list below shows all issues that passed the filter. CrashSight automatically clusters events, with each row in the list representing an issue that groups events sharing the same cause. To quickly view the details of an issue, hover your mouse over it and click "Quick Preview".
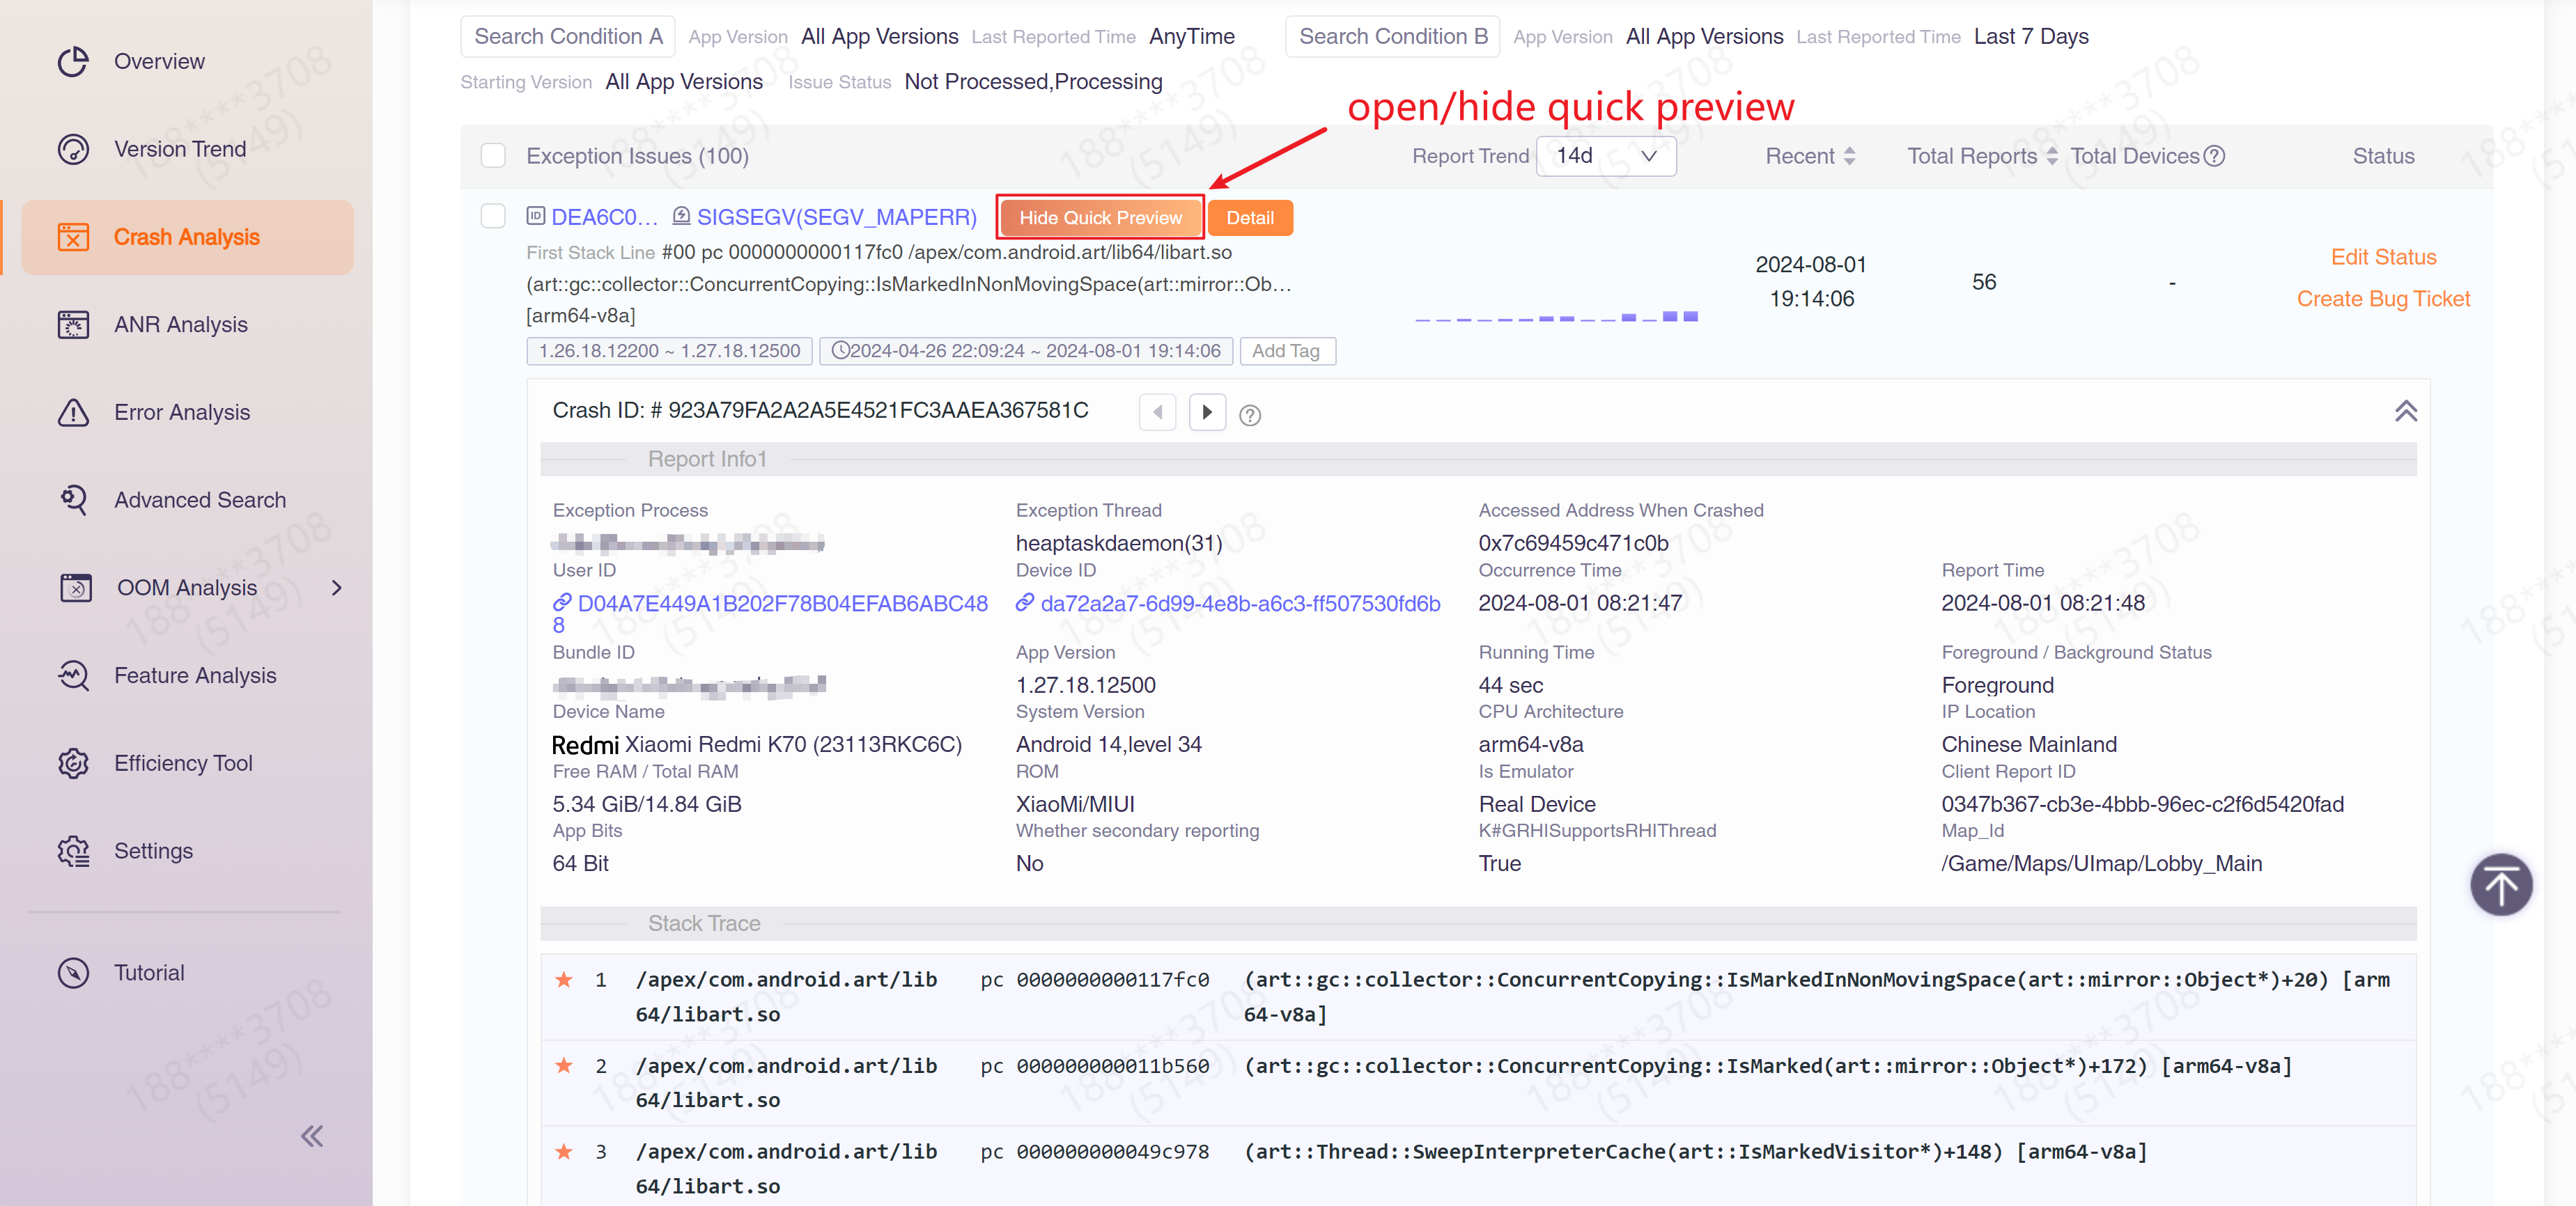
Click "Issue Detail" to jump to Issue Detail.
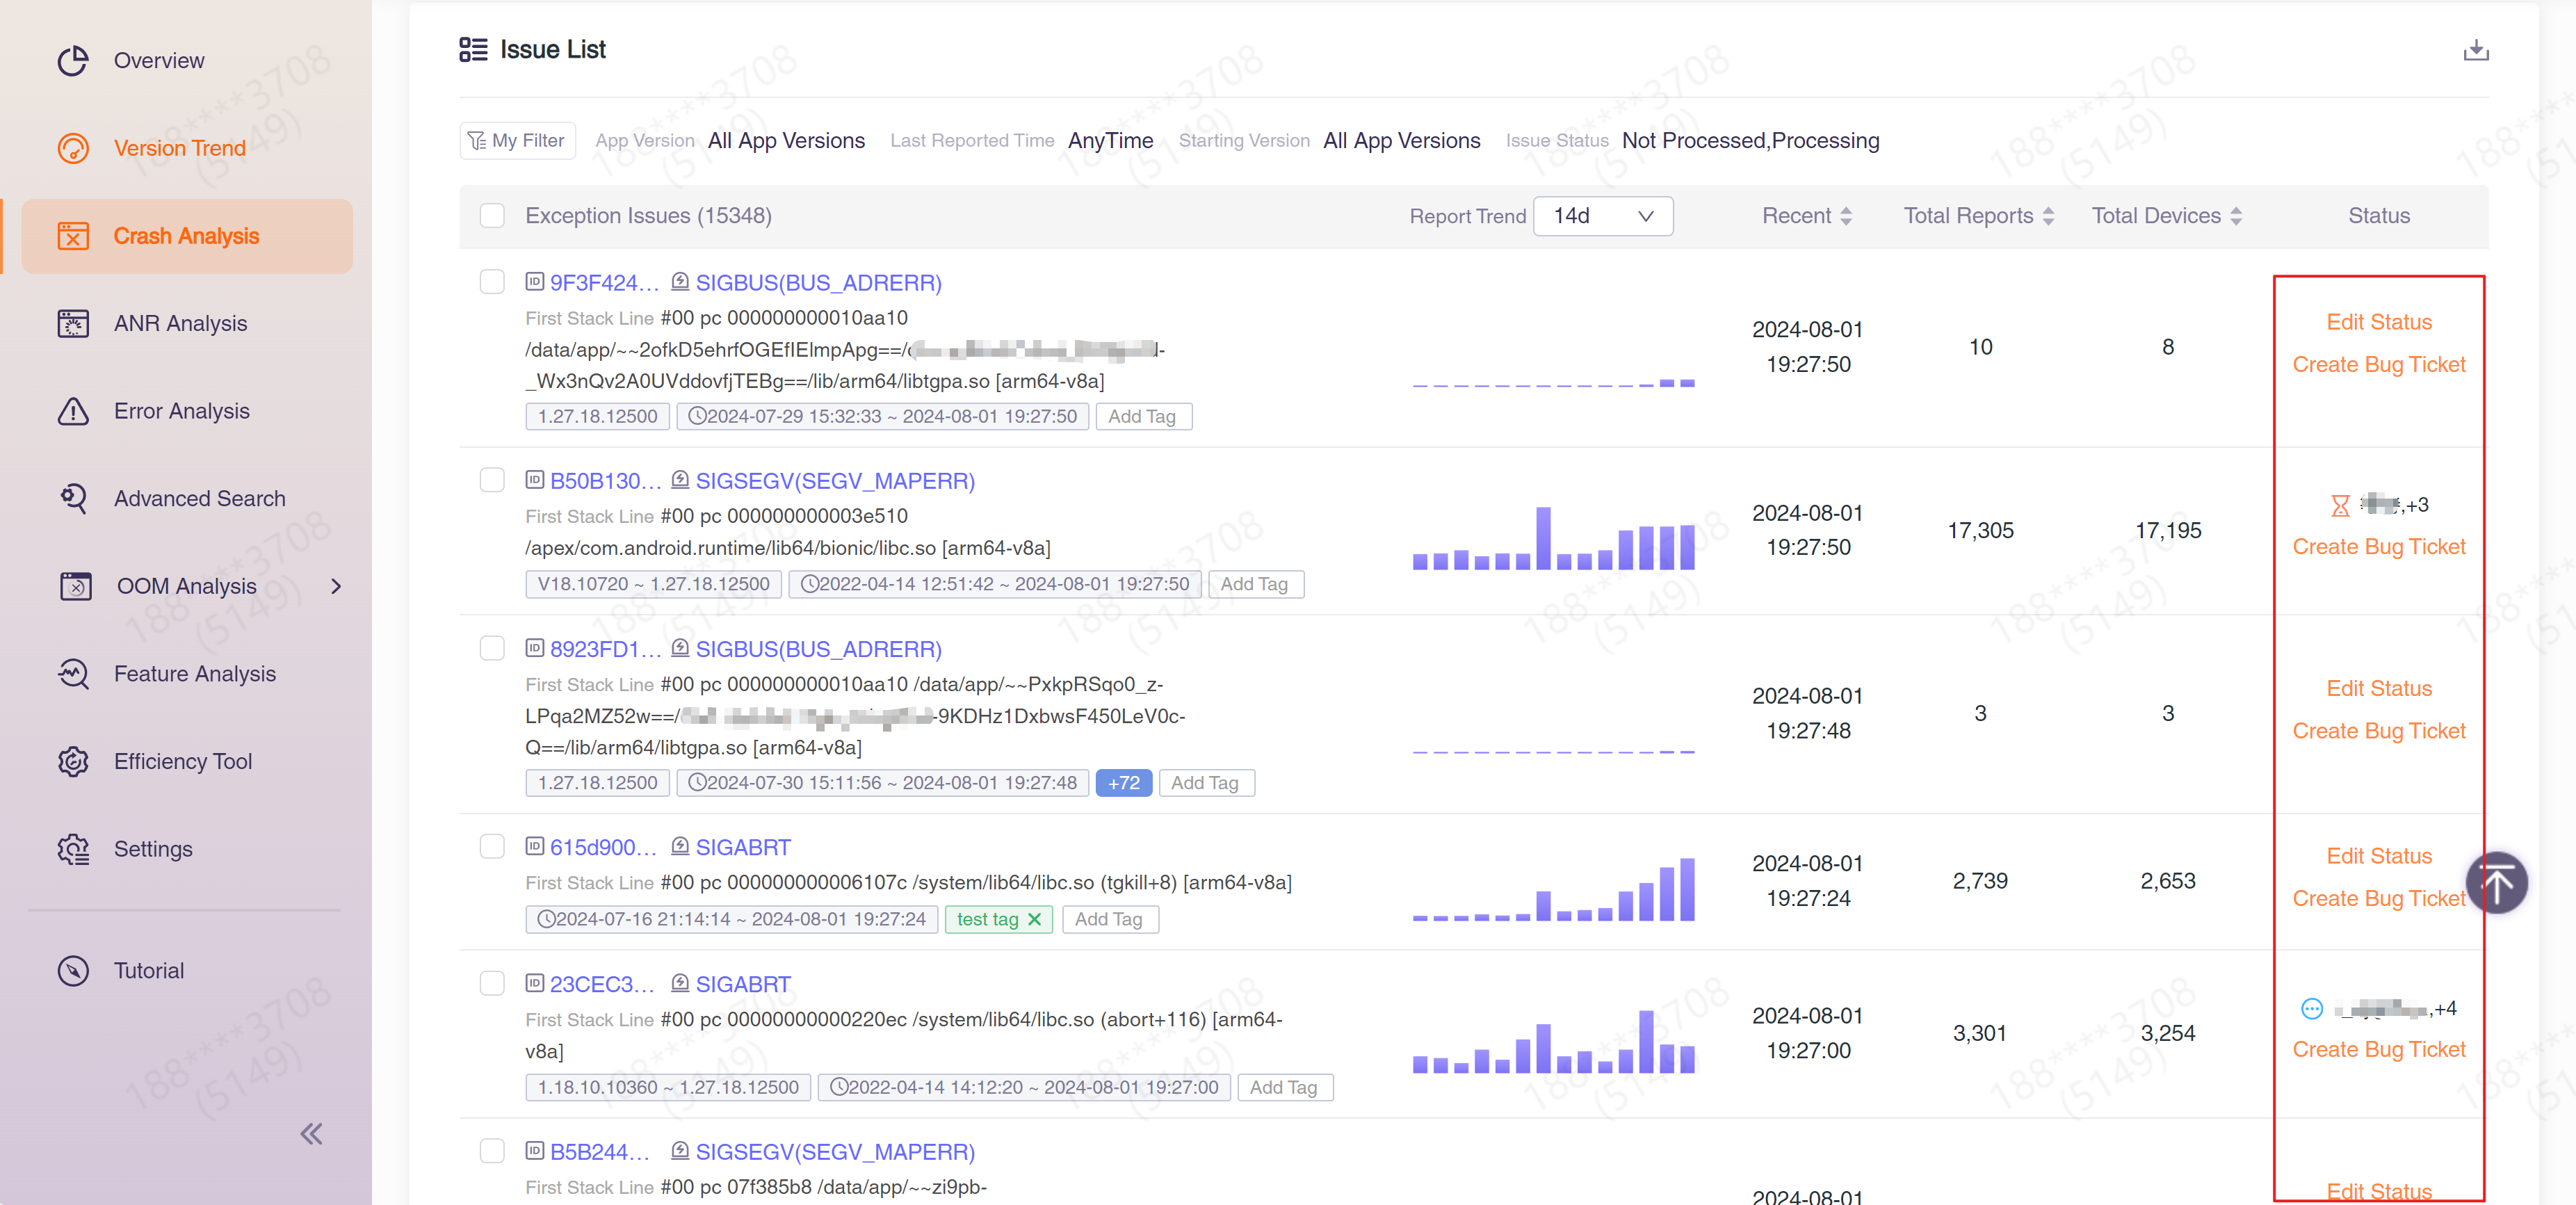
Click "Edit Status" on the right to set the issue assignee and issue status. Click "Create Bug Form" to quickly create a bug form on TAPD or Jira. This function needs to be configured in Integrations before it can be used.
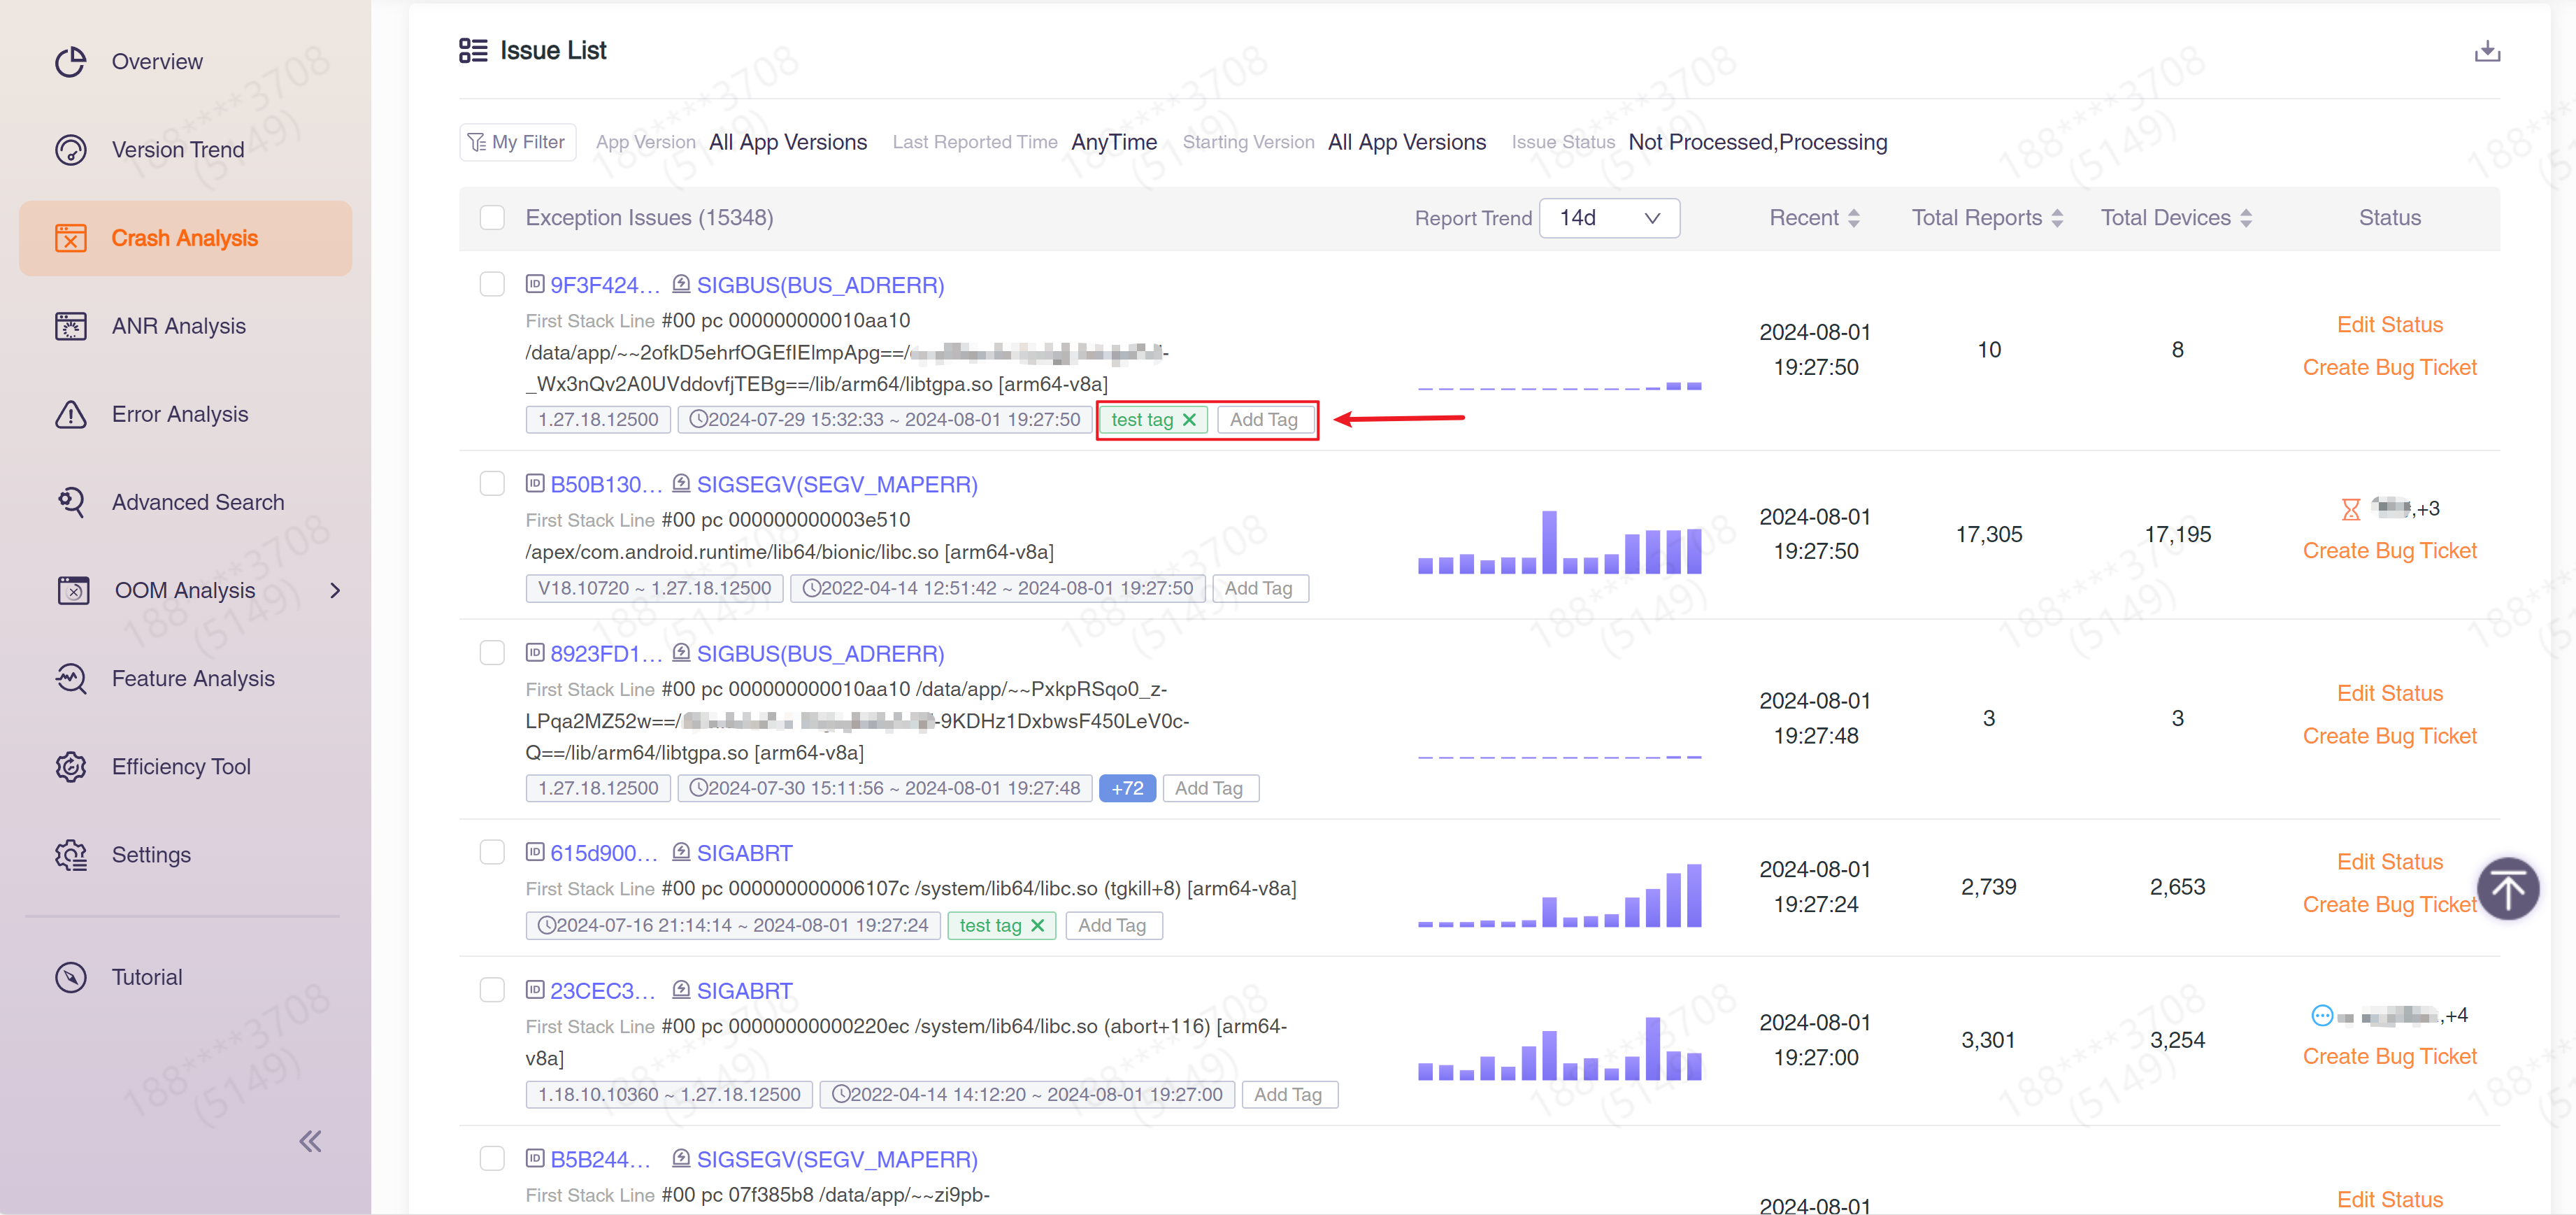
Click "Add Tag" below to add a tag to the issue. Tags are often used to mark certain characteristics of an issue, such as the known cause ("FD overflow"), the scope of the issue ("Experience Server", "Huawei Exclusive Crash"), the module in which the issue occurred ("libc", "Update module") or just a prompt ("Urgent!"). The added tags can be viewed and managed in Manage Tags.
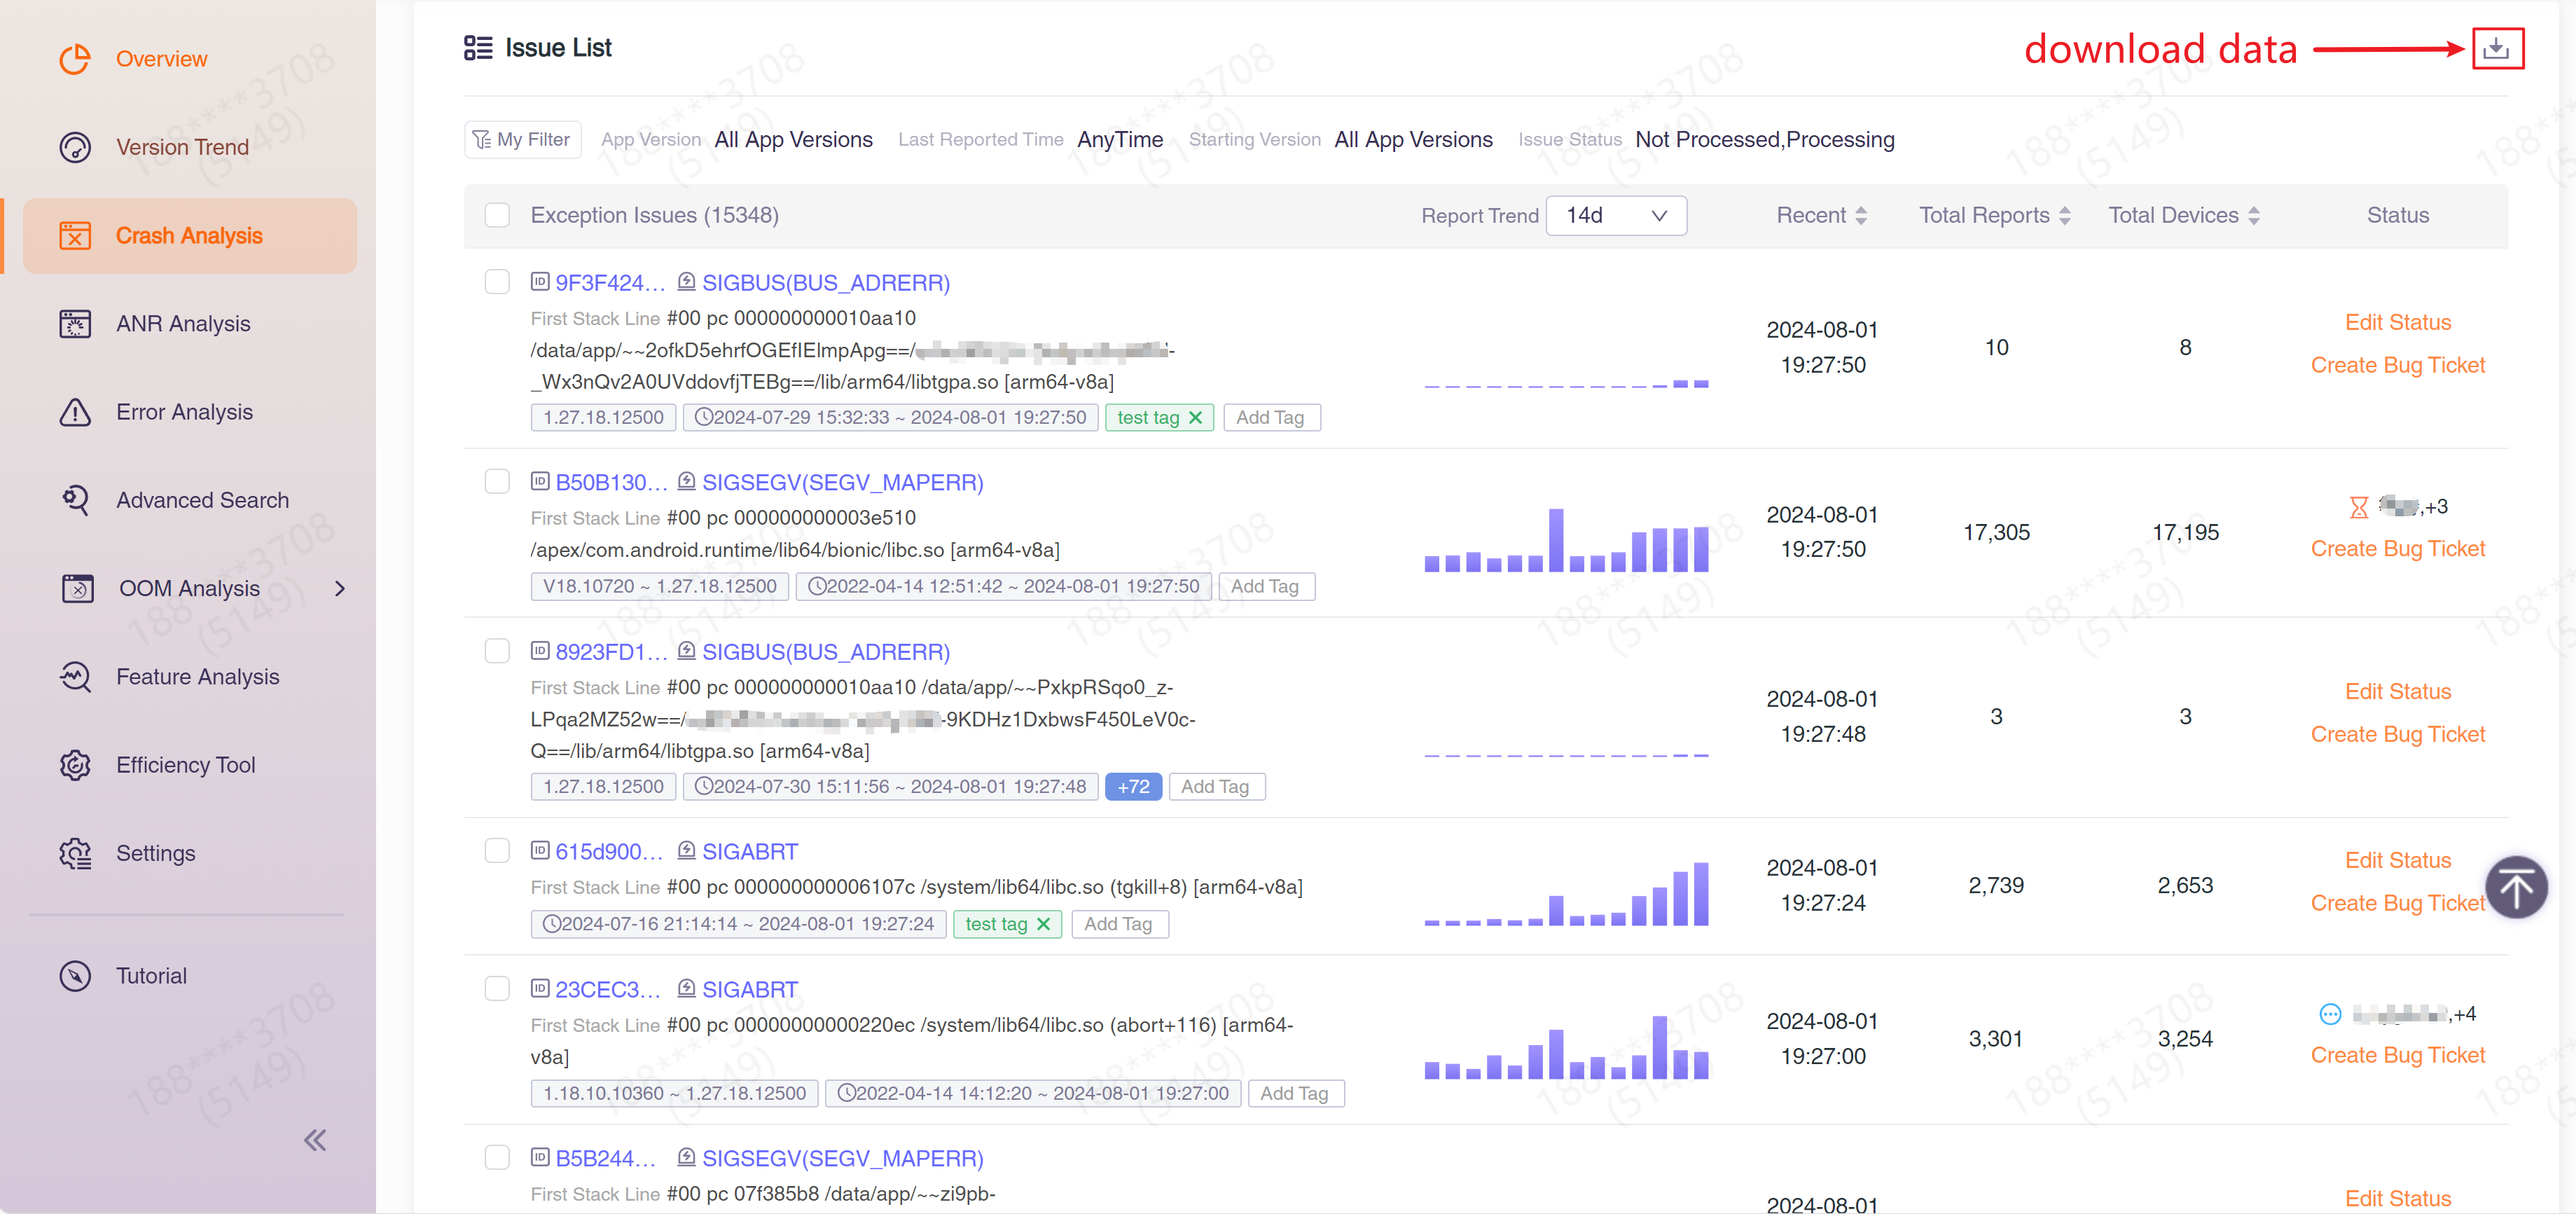
A "Data Download" button is provided in the list title bar, which can convert all issues into xlsx tables and download them locally.
1.1 Issue Grouping
CrashSight groups events that occur for the same reason together, this process is called issue grouping. The steps that CrashSight takes to perform issue grouping are:
- Determine if each stack line of the event is an application stack line.
- From all the stack lines, pick several lines as key lines. The application stack lines are preferred as key lines, and sometimes the error messages are used as key lines.
- Group events that have the same key lines into one issue.
Depending on the type of event, the method of judging the application stack lines and the method of picking key lines are different. The following are the specific methods:
1.1.1 Android Java Crash, ANR
The methods for Android Java crash and ANR are the same.
Method of determining the application stack lines: The stack line contains bundleID, or the stack starts with com. but not starts with android., java., dalvik., javax., junit., org.apache.http., org.json., org.w3c., org.xml., org.xmlpull, UnityEngine, com.unity3d.
Method of picking key lines: Pick three lines from application lines in stack order, and then system lines if there's not enough application lines. Pick error message as well.
1.1.2 Android native crash
Method of determining the application stack lines: 1.Stack contains bundleID 2.Path contains /data/data/, app-lib 3.So name does not contain libc.so, libdvm.so, libskia.so, libnvddk_2d_v2.so, libnvwsi.so, libskia.so, libjavacore.so, libc.so, libandroid_runtime.so, app_process and path does not contain /data/data/, app-lib. process and path does not contain /system/ and library name contains .so.
Method of picking key lines:
- No native application stack line, no java application stack line: 4 lines of native stack + 1 line of java stack
- No native application stack line, with java application stack line: 1 line native stack + 3 lines java application stack
- With native application stack lines: 2 lines of native application stacks
- With native application stack lines, first java line is a native method (including Native Method): 2 lines of native application stack + first java line of java stack
Note: For Android native crashes, address information in the stack lines is considered while grouping.
1.1.3 iOS crashes
Method of determining the application stack lines:
- If process name is not empty, a line in which module name is equal to process name is determined as a application stack line.
- If process name is empty, a line does not contain main, or a line which is not the last 3 lines, is determined to be a application stack line.
Method of picking key lines:
- If there are more than two lines of application lines, then take three lines of application lines, and error messages
- If there are less than three application lines and there is application line exsisting, then take the application line and the stack before and after the application line, up to a maximum of five lines, as well as the error message
- If there is no application line, take the first five lines of the stack, as well as the error message
Note: For iOS crashes, address information in stack lines is not considered while grouping.
1.1.4 Windows crashes
Method of determining the application stack lines:
- Module path does not contain "windows" or "system".
Method of picking key lines:
- If there are more than two lines of application lines, pick three lines of application lines, and error name
- If there are less than three lines of application lines, pick three lines from application lines in stack order, and then system lines if there's not enough application lines. Pick error name as well.
Note: For Windows crashes, address information in stack lines is not considered while grouping.
1.1.5 Errors
Issue grouping of errors does not perform application stack line determining. Android errors use the exception message, exception name, and the full stack as key lines; iOS errors use the exception name and the full stack as key lines; Windows errors use the exception name, and the full stack as key lines.
2 Issue Detail
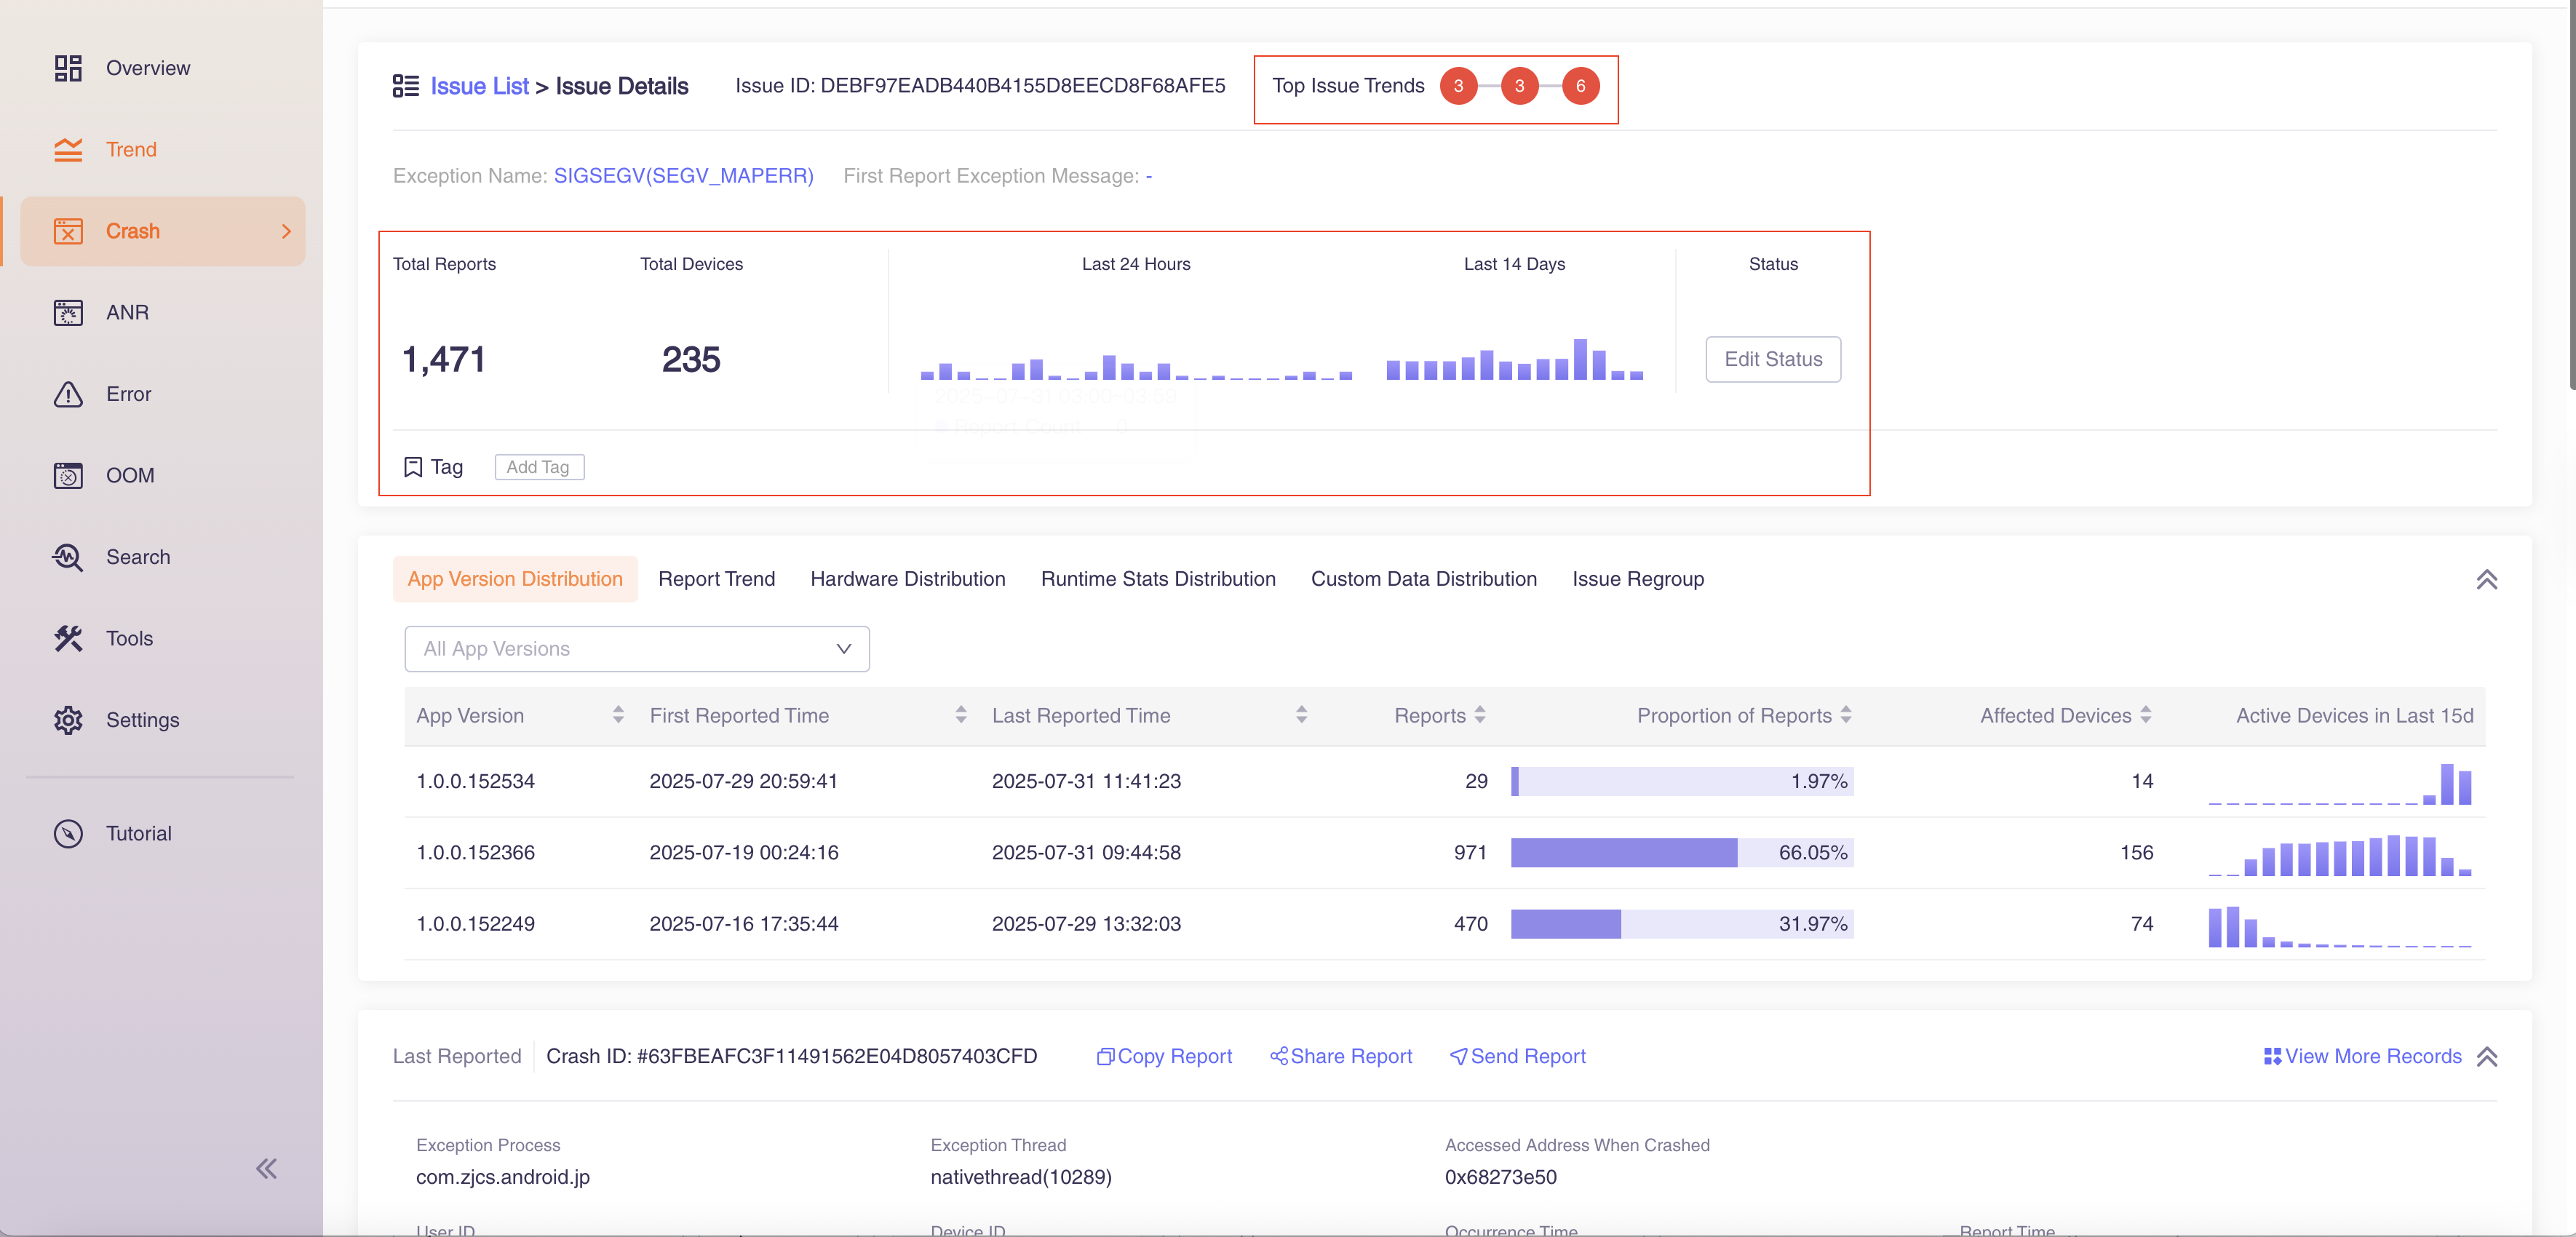
Issue details show detailed information about an issue. The top of the page features a "Top Issue Trends", which automatically appears and directly displays the real-time ranking of the current issue among all tracked crashes. Additionally, the top of the page displays the issue ID, error name, first reported exception message, first reported error stack, number of occurrences, and number of affected devices for this issue. You can also change the issue status and quickly create a bug form here.
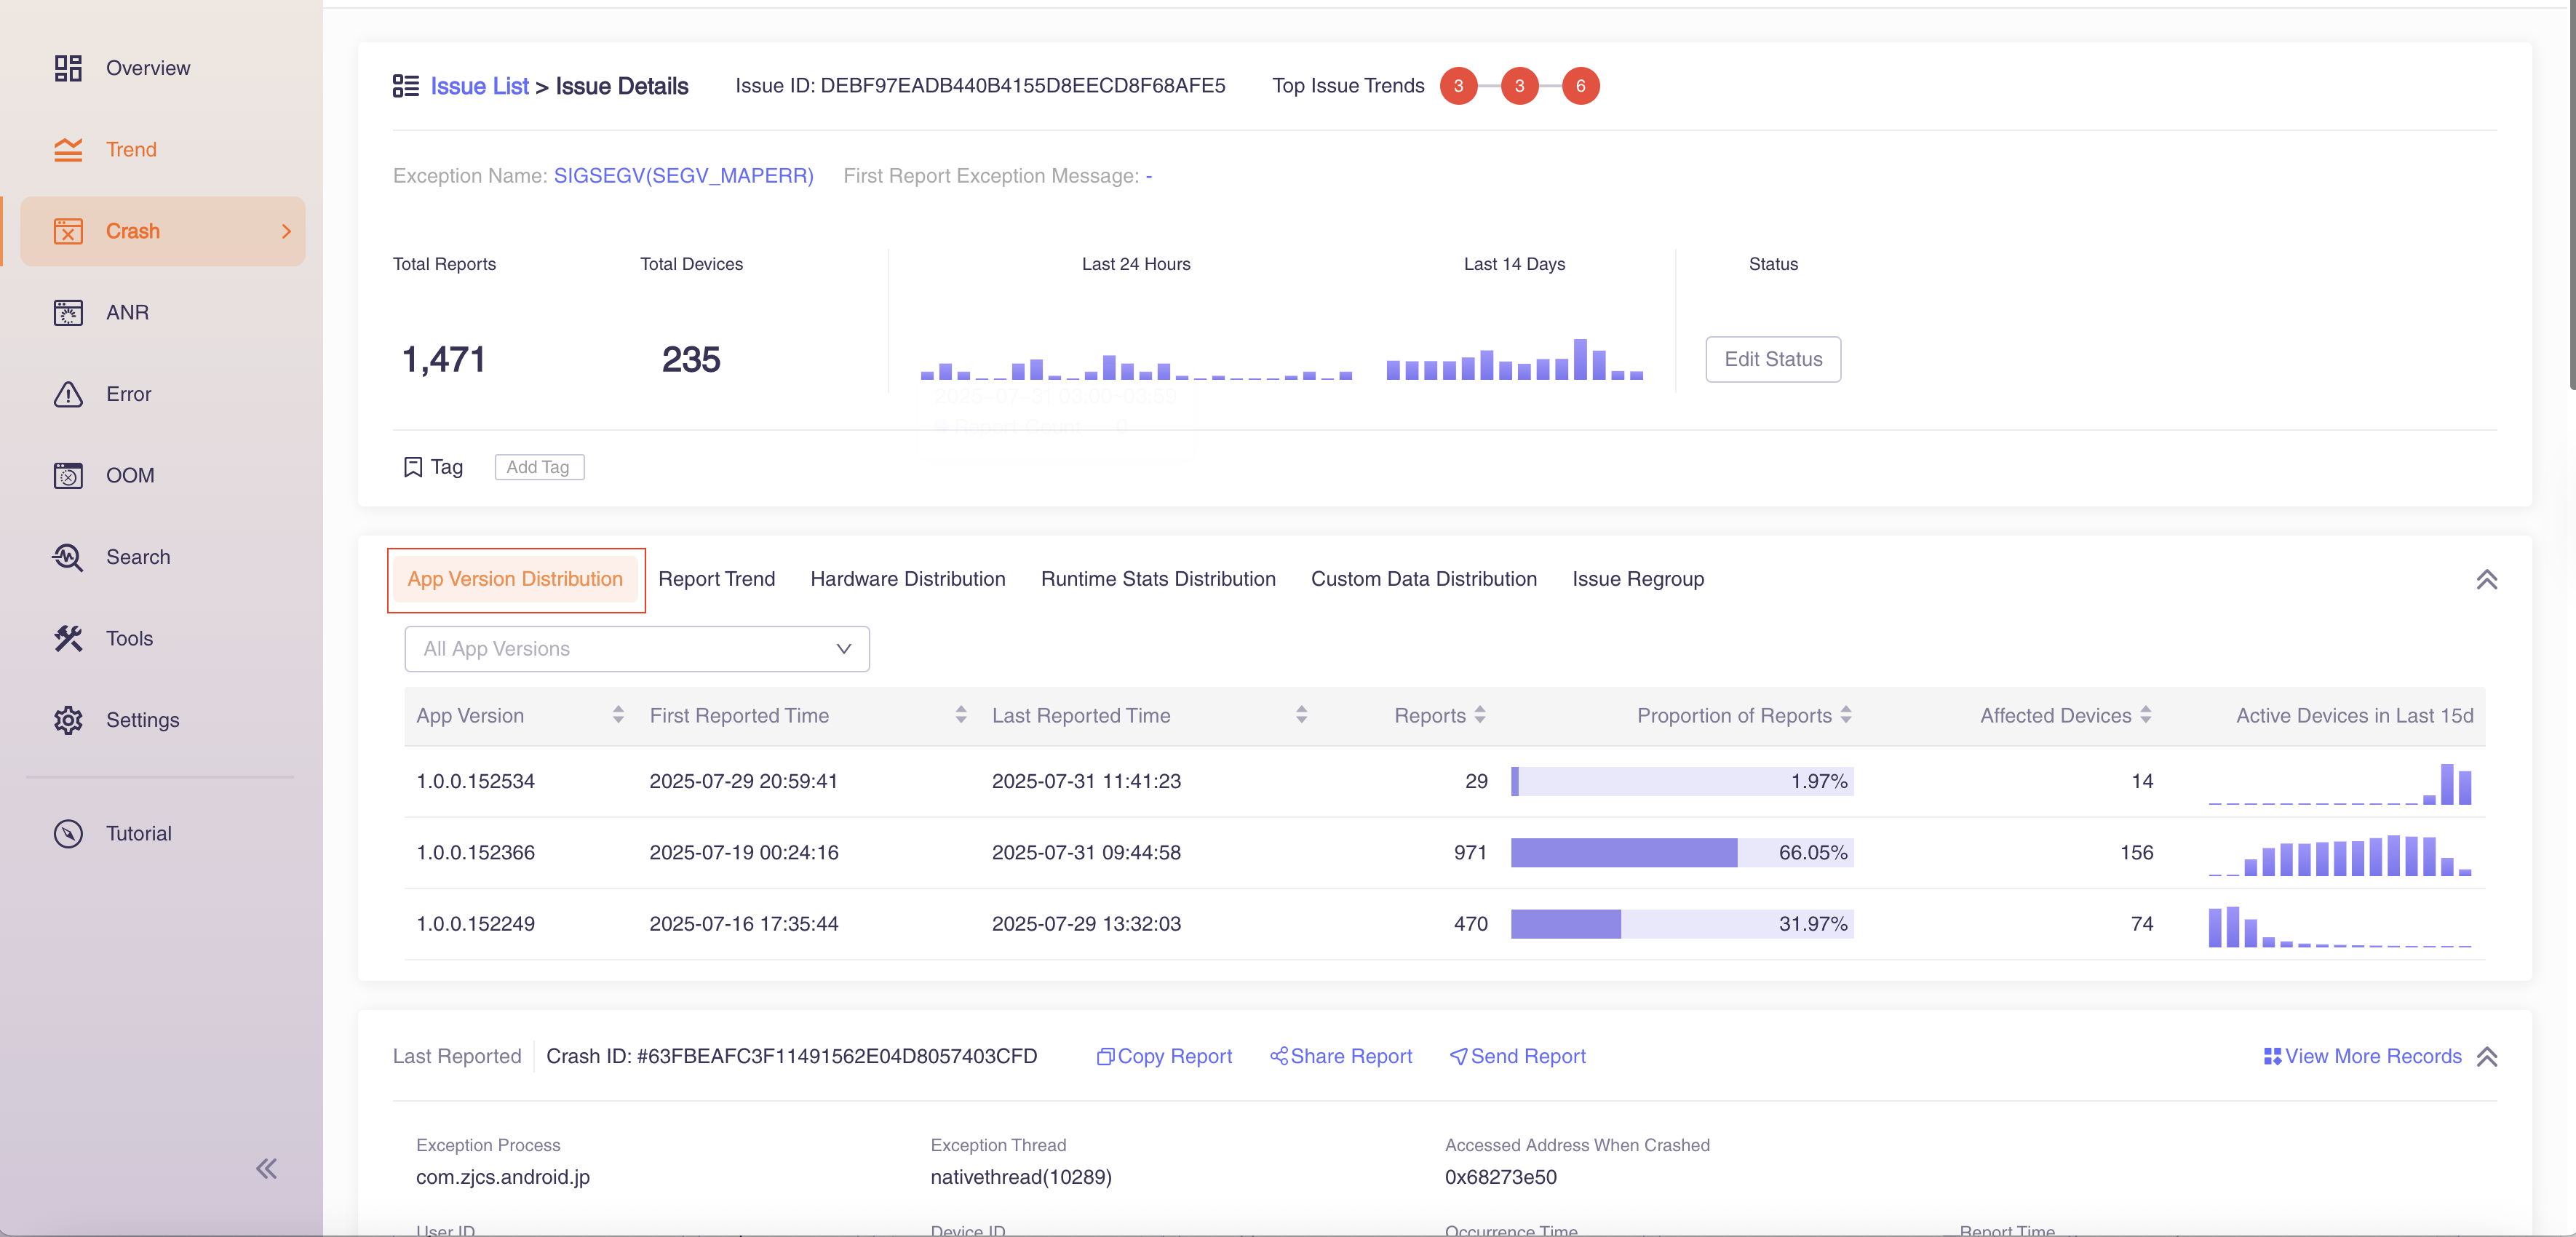
2.1 Version Information
The second column shows the details of the issue classification. "Version Information" lists the situations in which this issue occurs in each version.
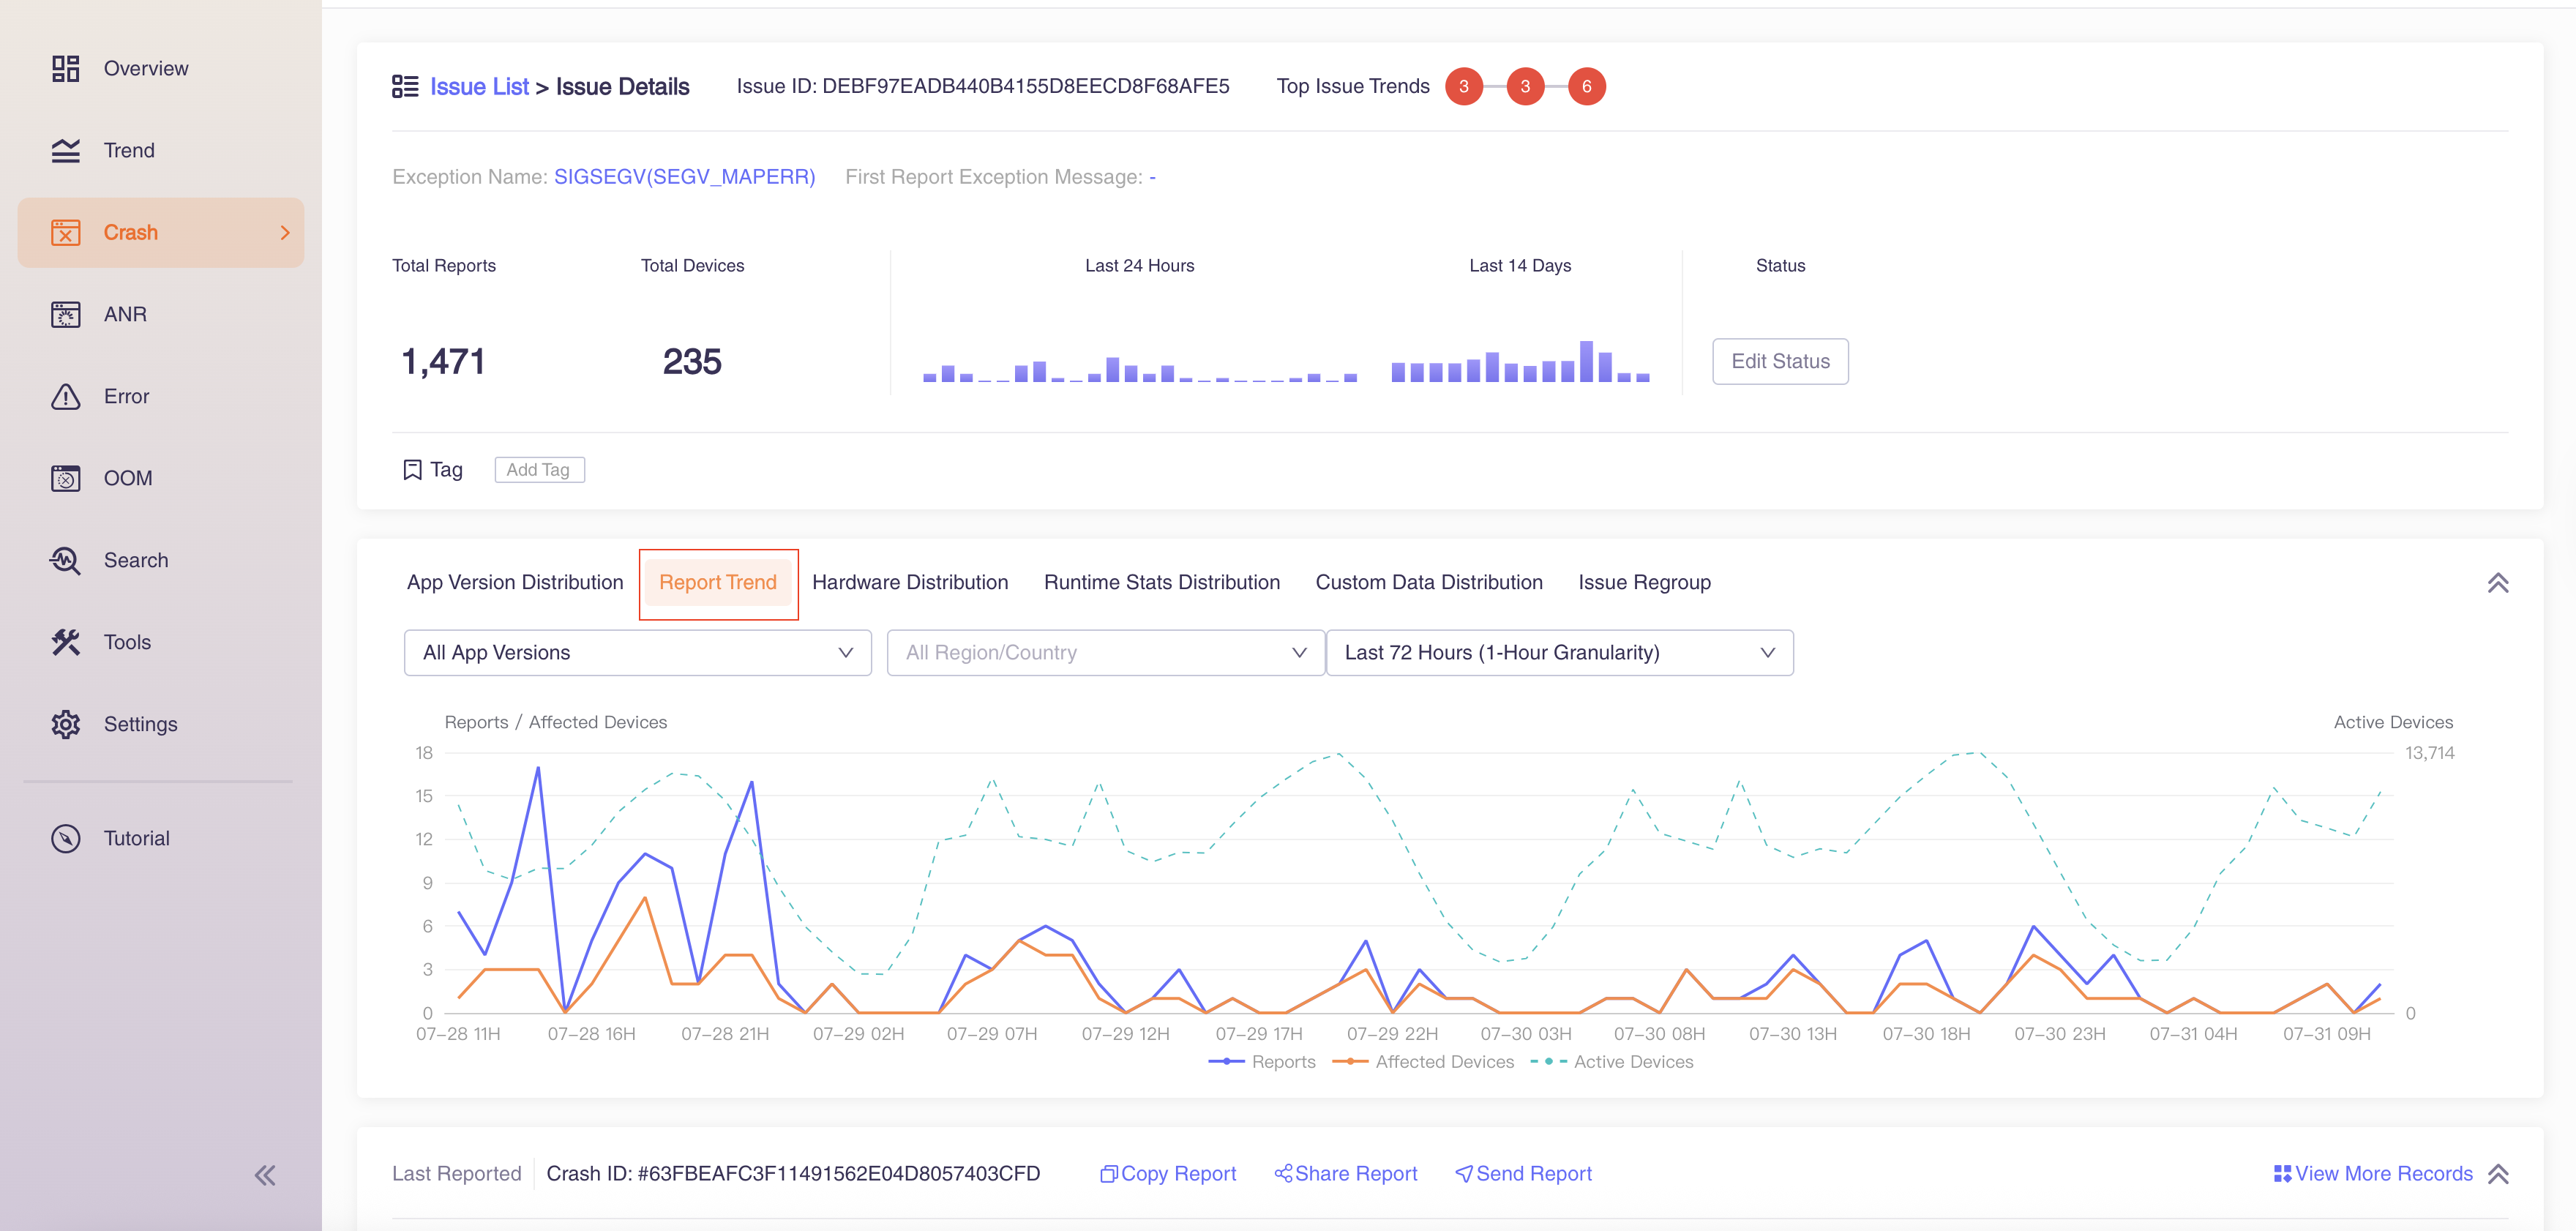
2.2 Report Trend
"Report Trend" displays the number of occurrences of the issue and the number of affected devices over time. You can select specific versions and time spans to further analyze reporting trends.
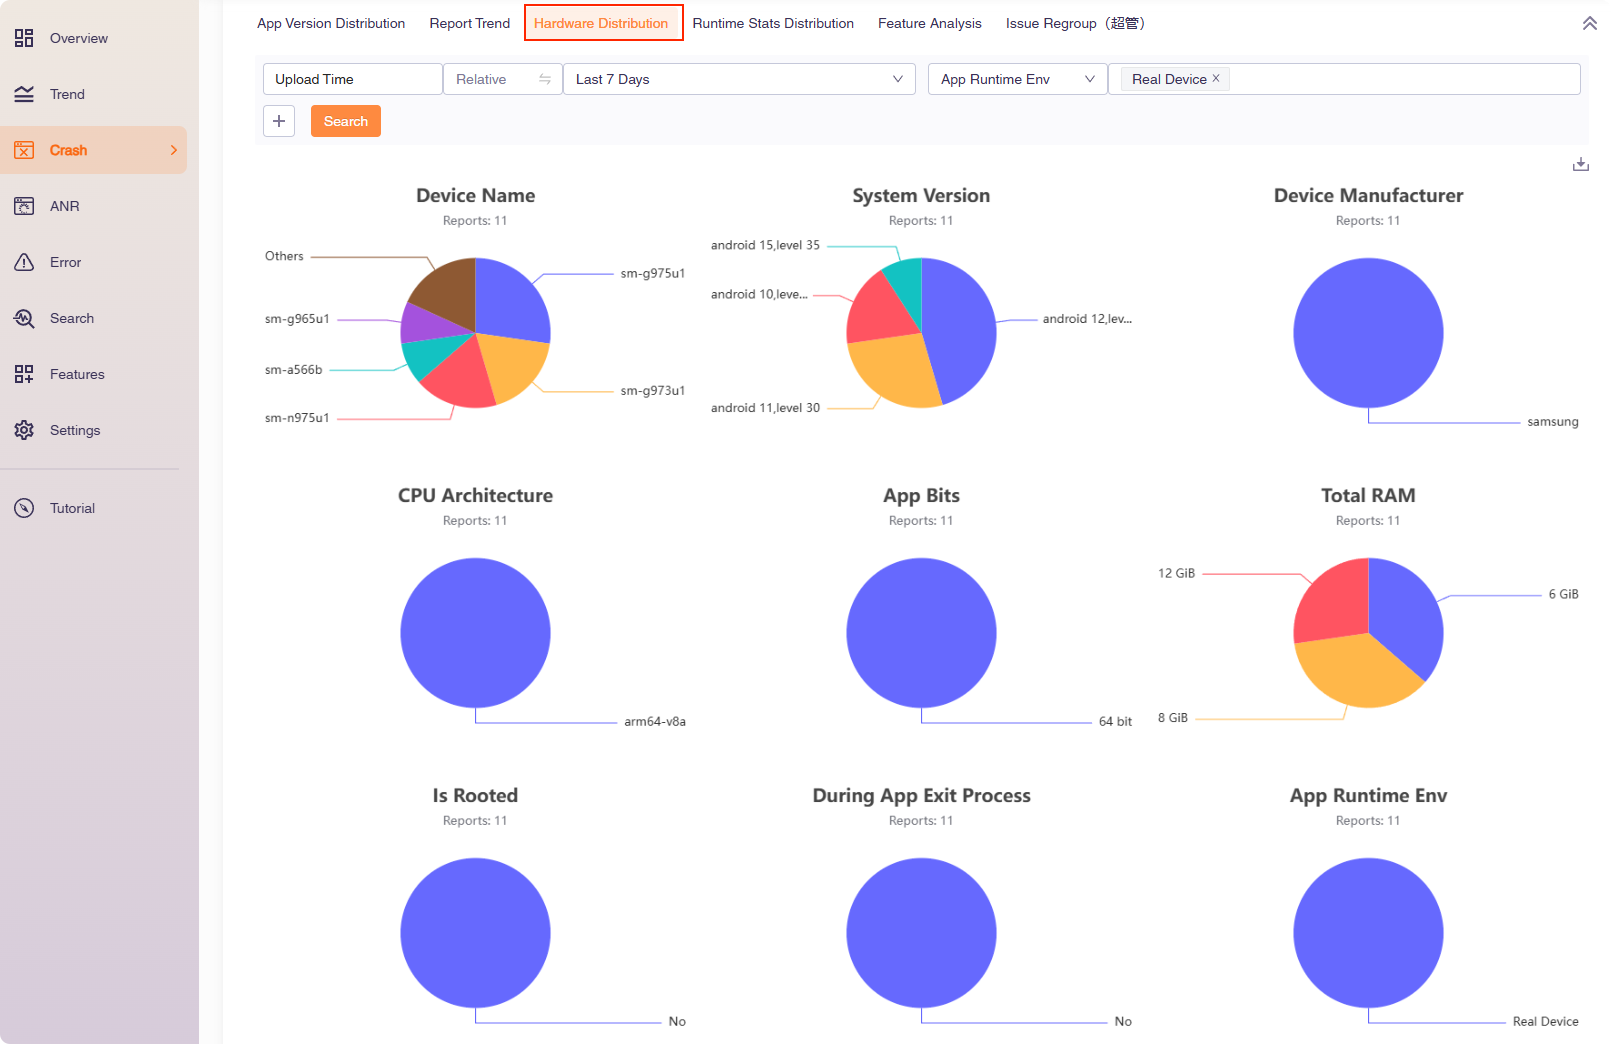
2.3 Hardware Information
"Hardware Information" displays the proportion of occurrences of this issue based on various model indicators. You can also provide the filter box above to search further.
2.4 User Behavior
"User Behavior" displays the proportion of occurrences of this issue based on various user behavior indicators. You can also provide the filter box above to search further.
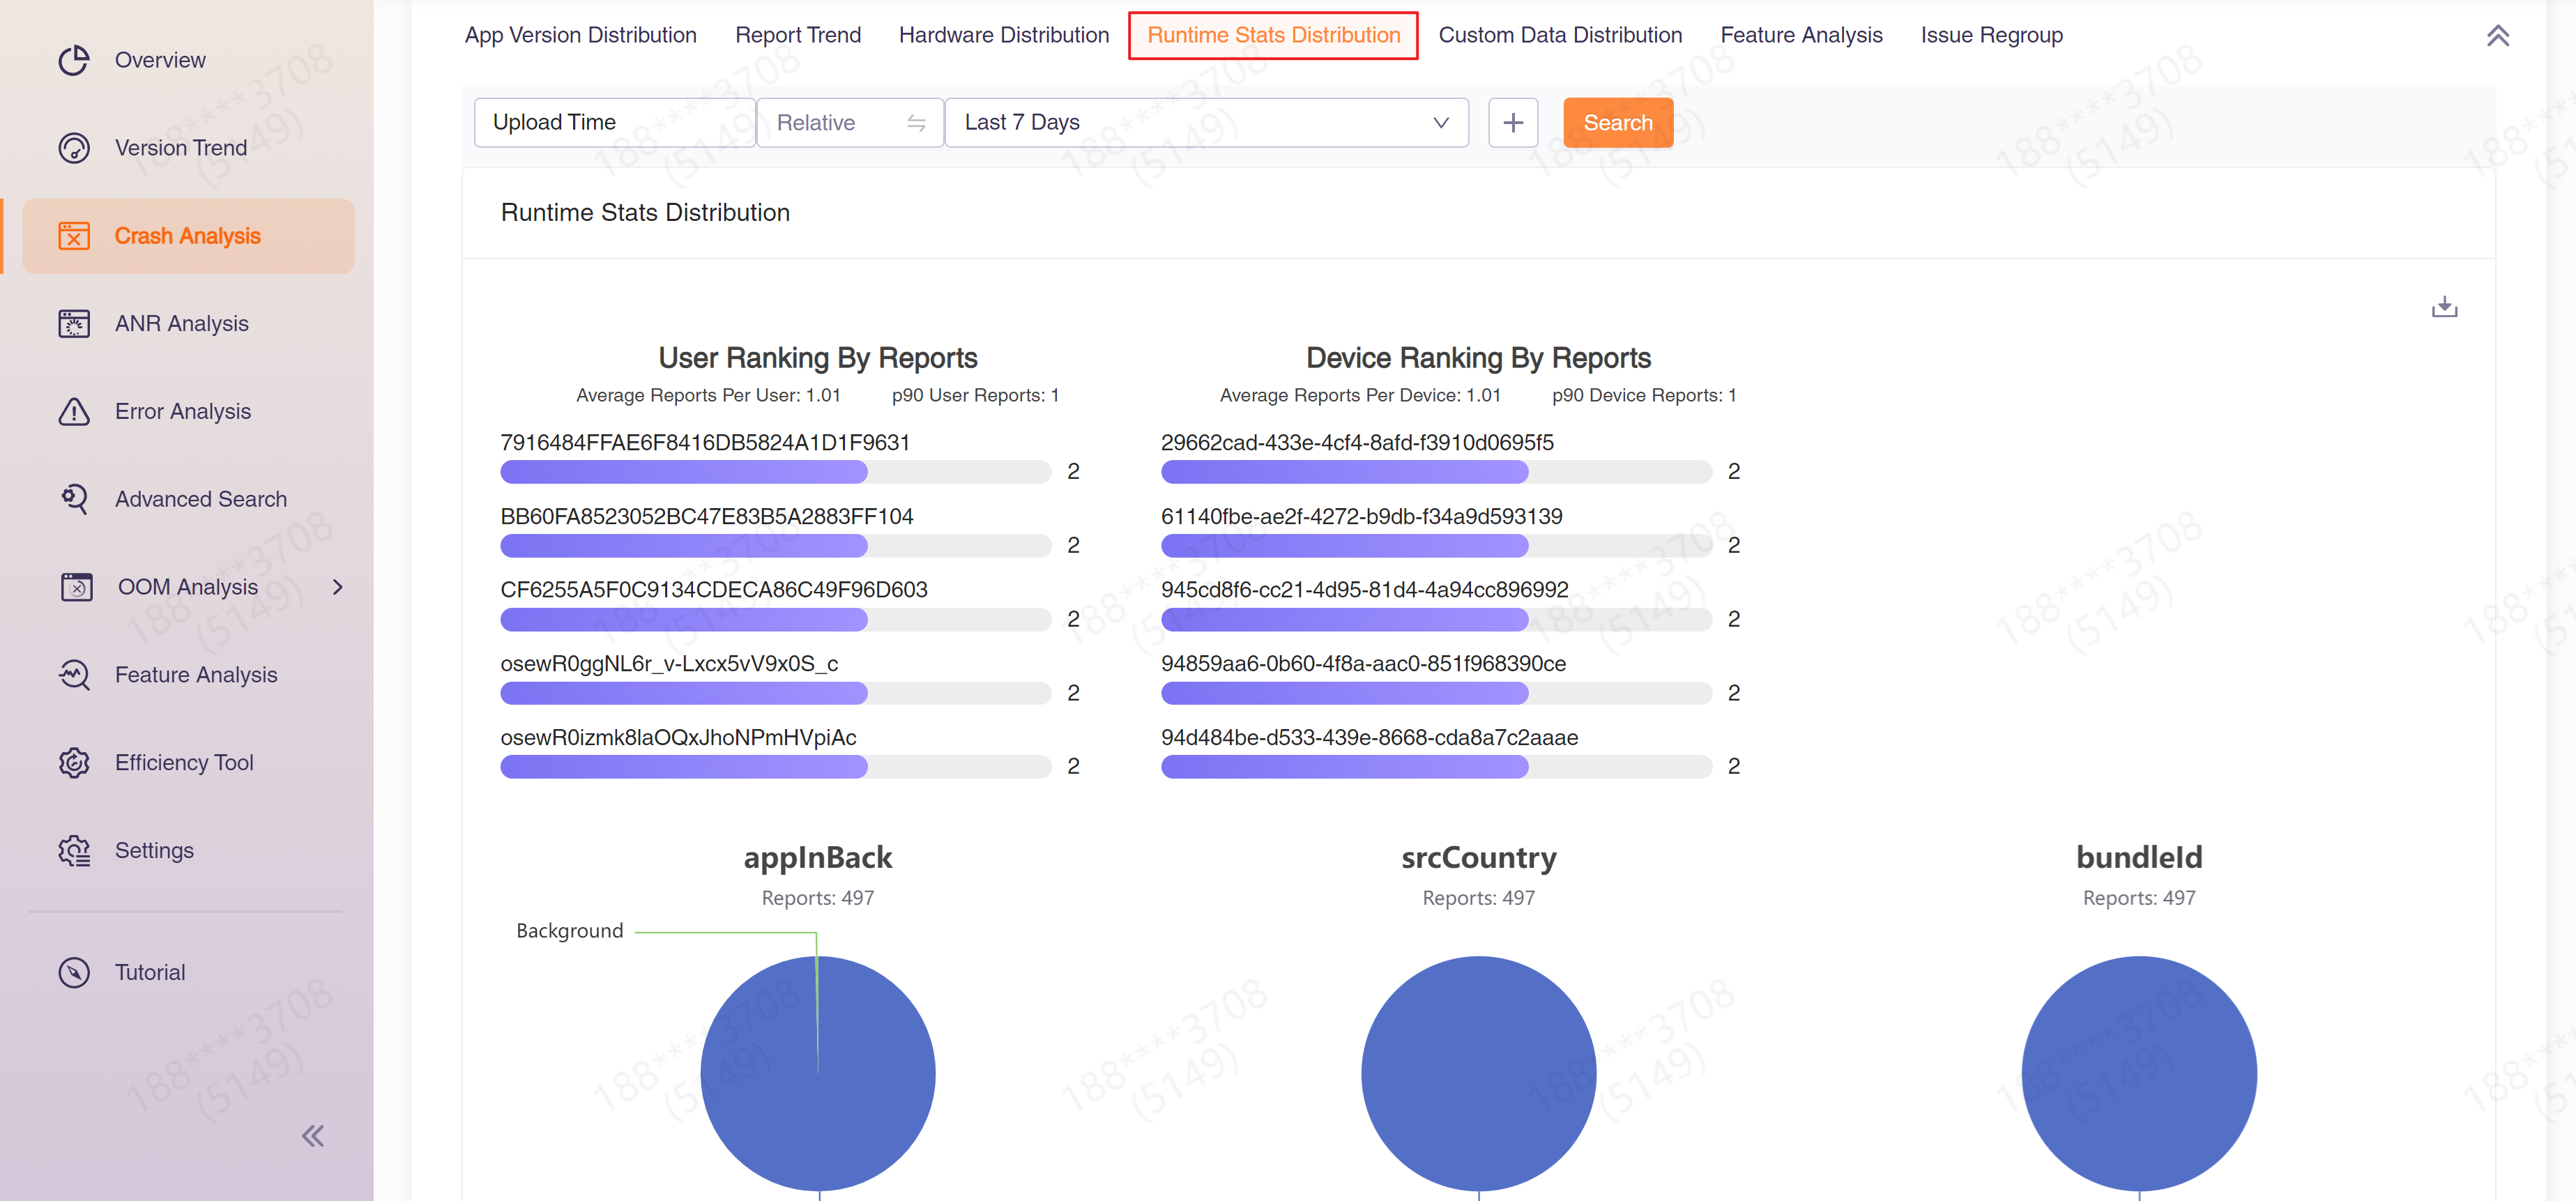
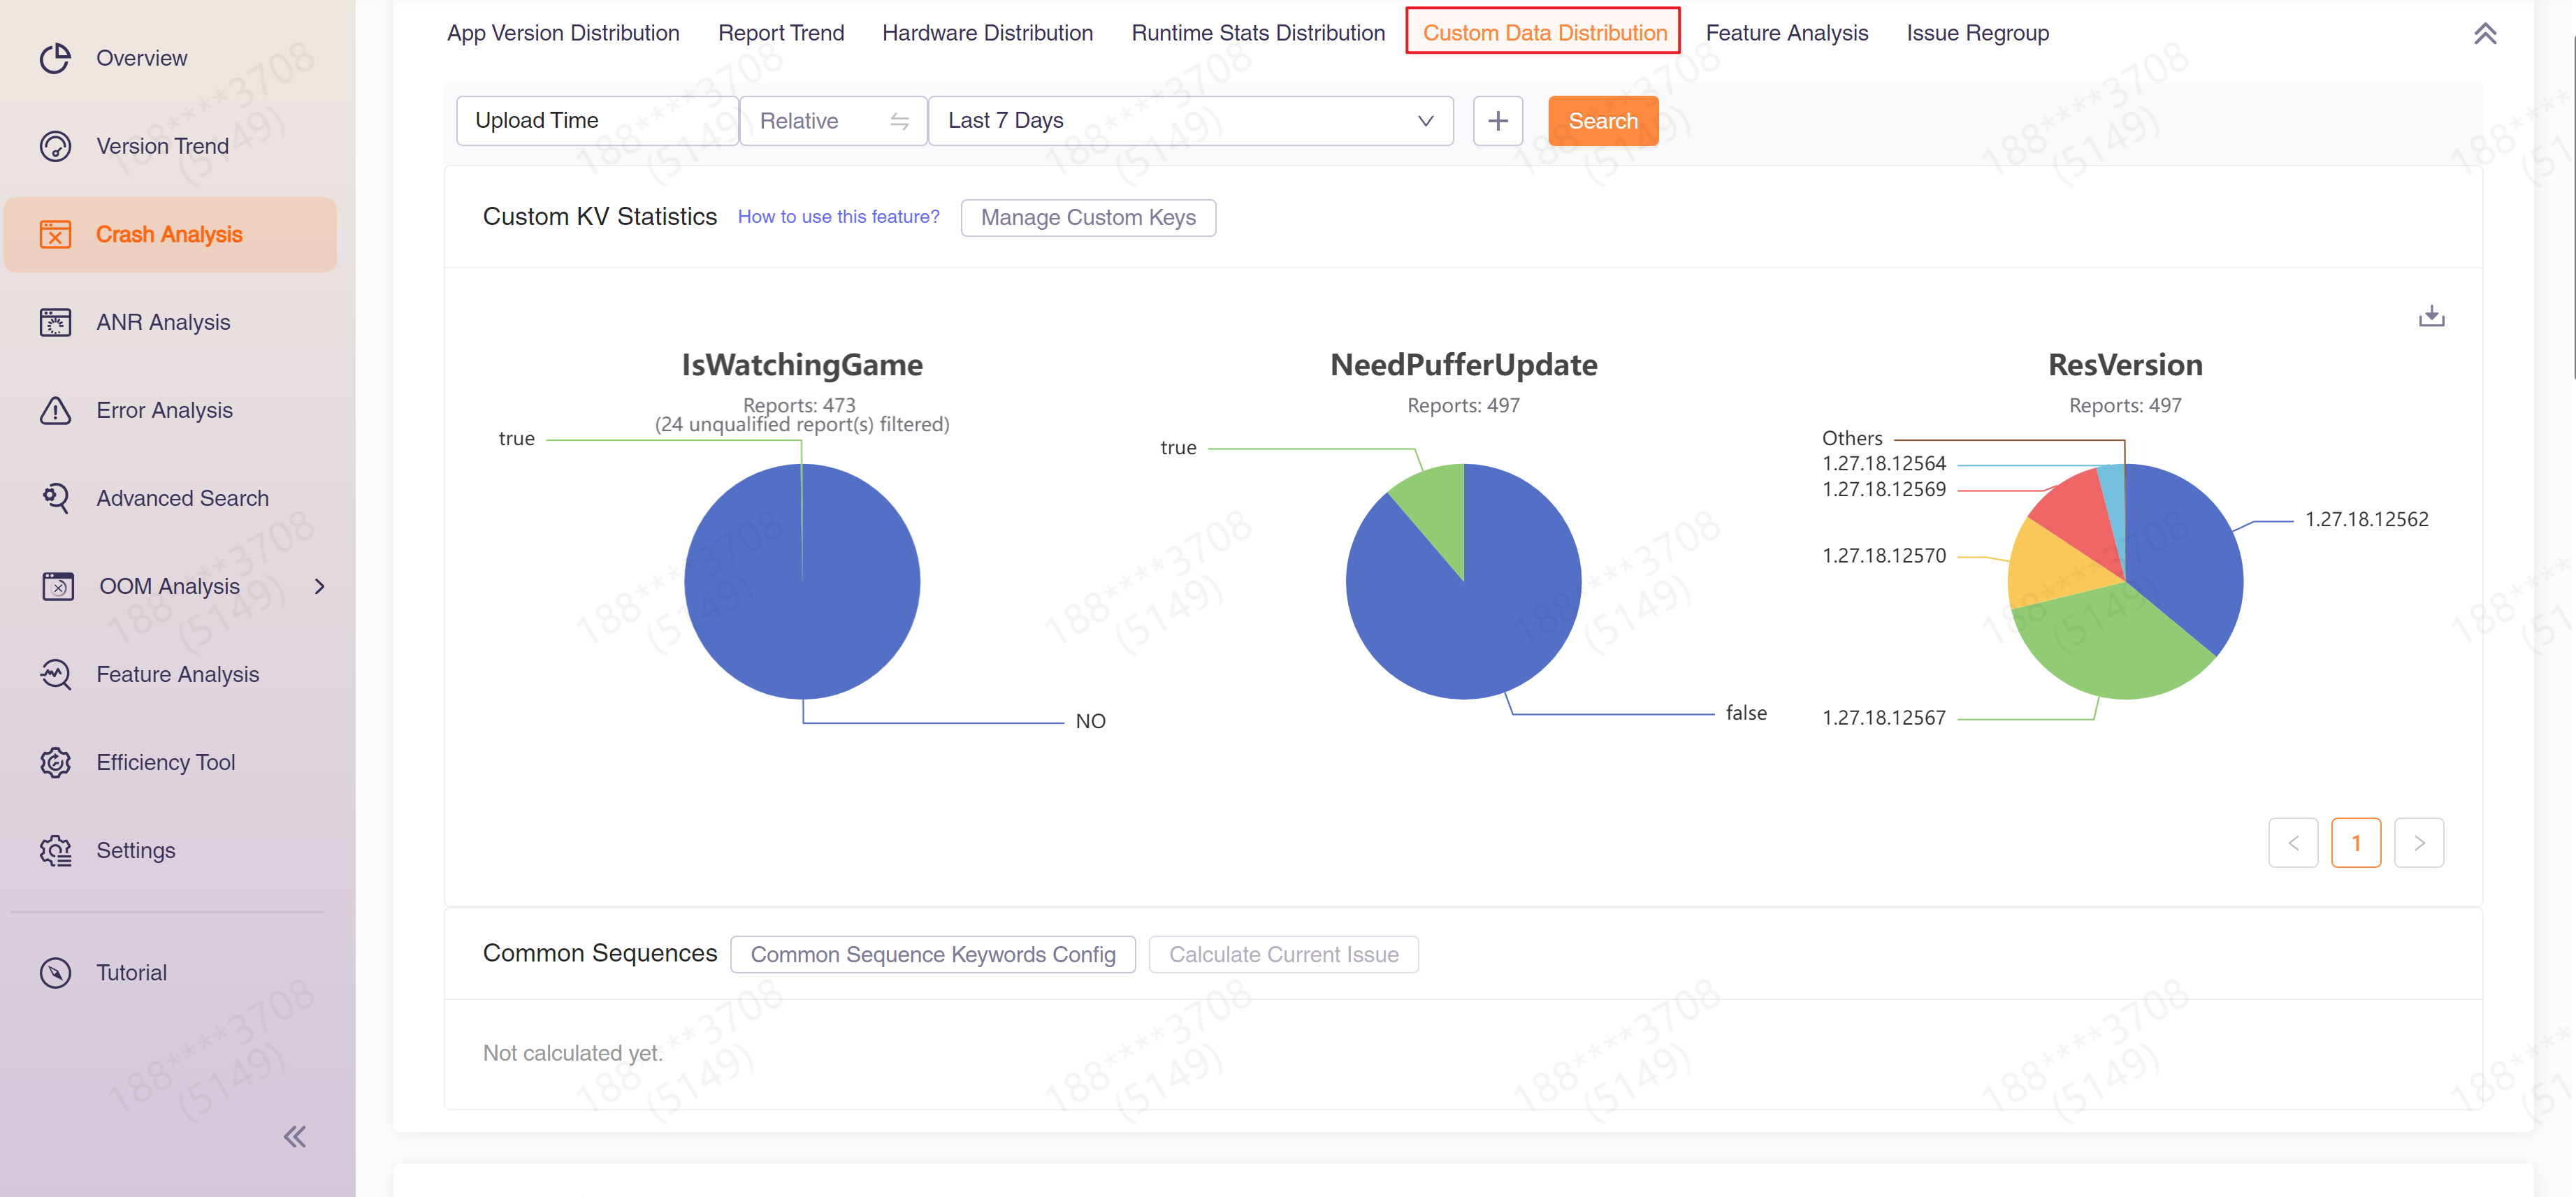
2.5 Customized Data
"Customized Data" displays the proportion of occurrences of this issue based on custom keywords. In order to use this function, you must first configure custom field analysis and display function. You can also provide the filter box above to search further.
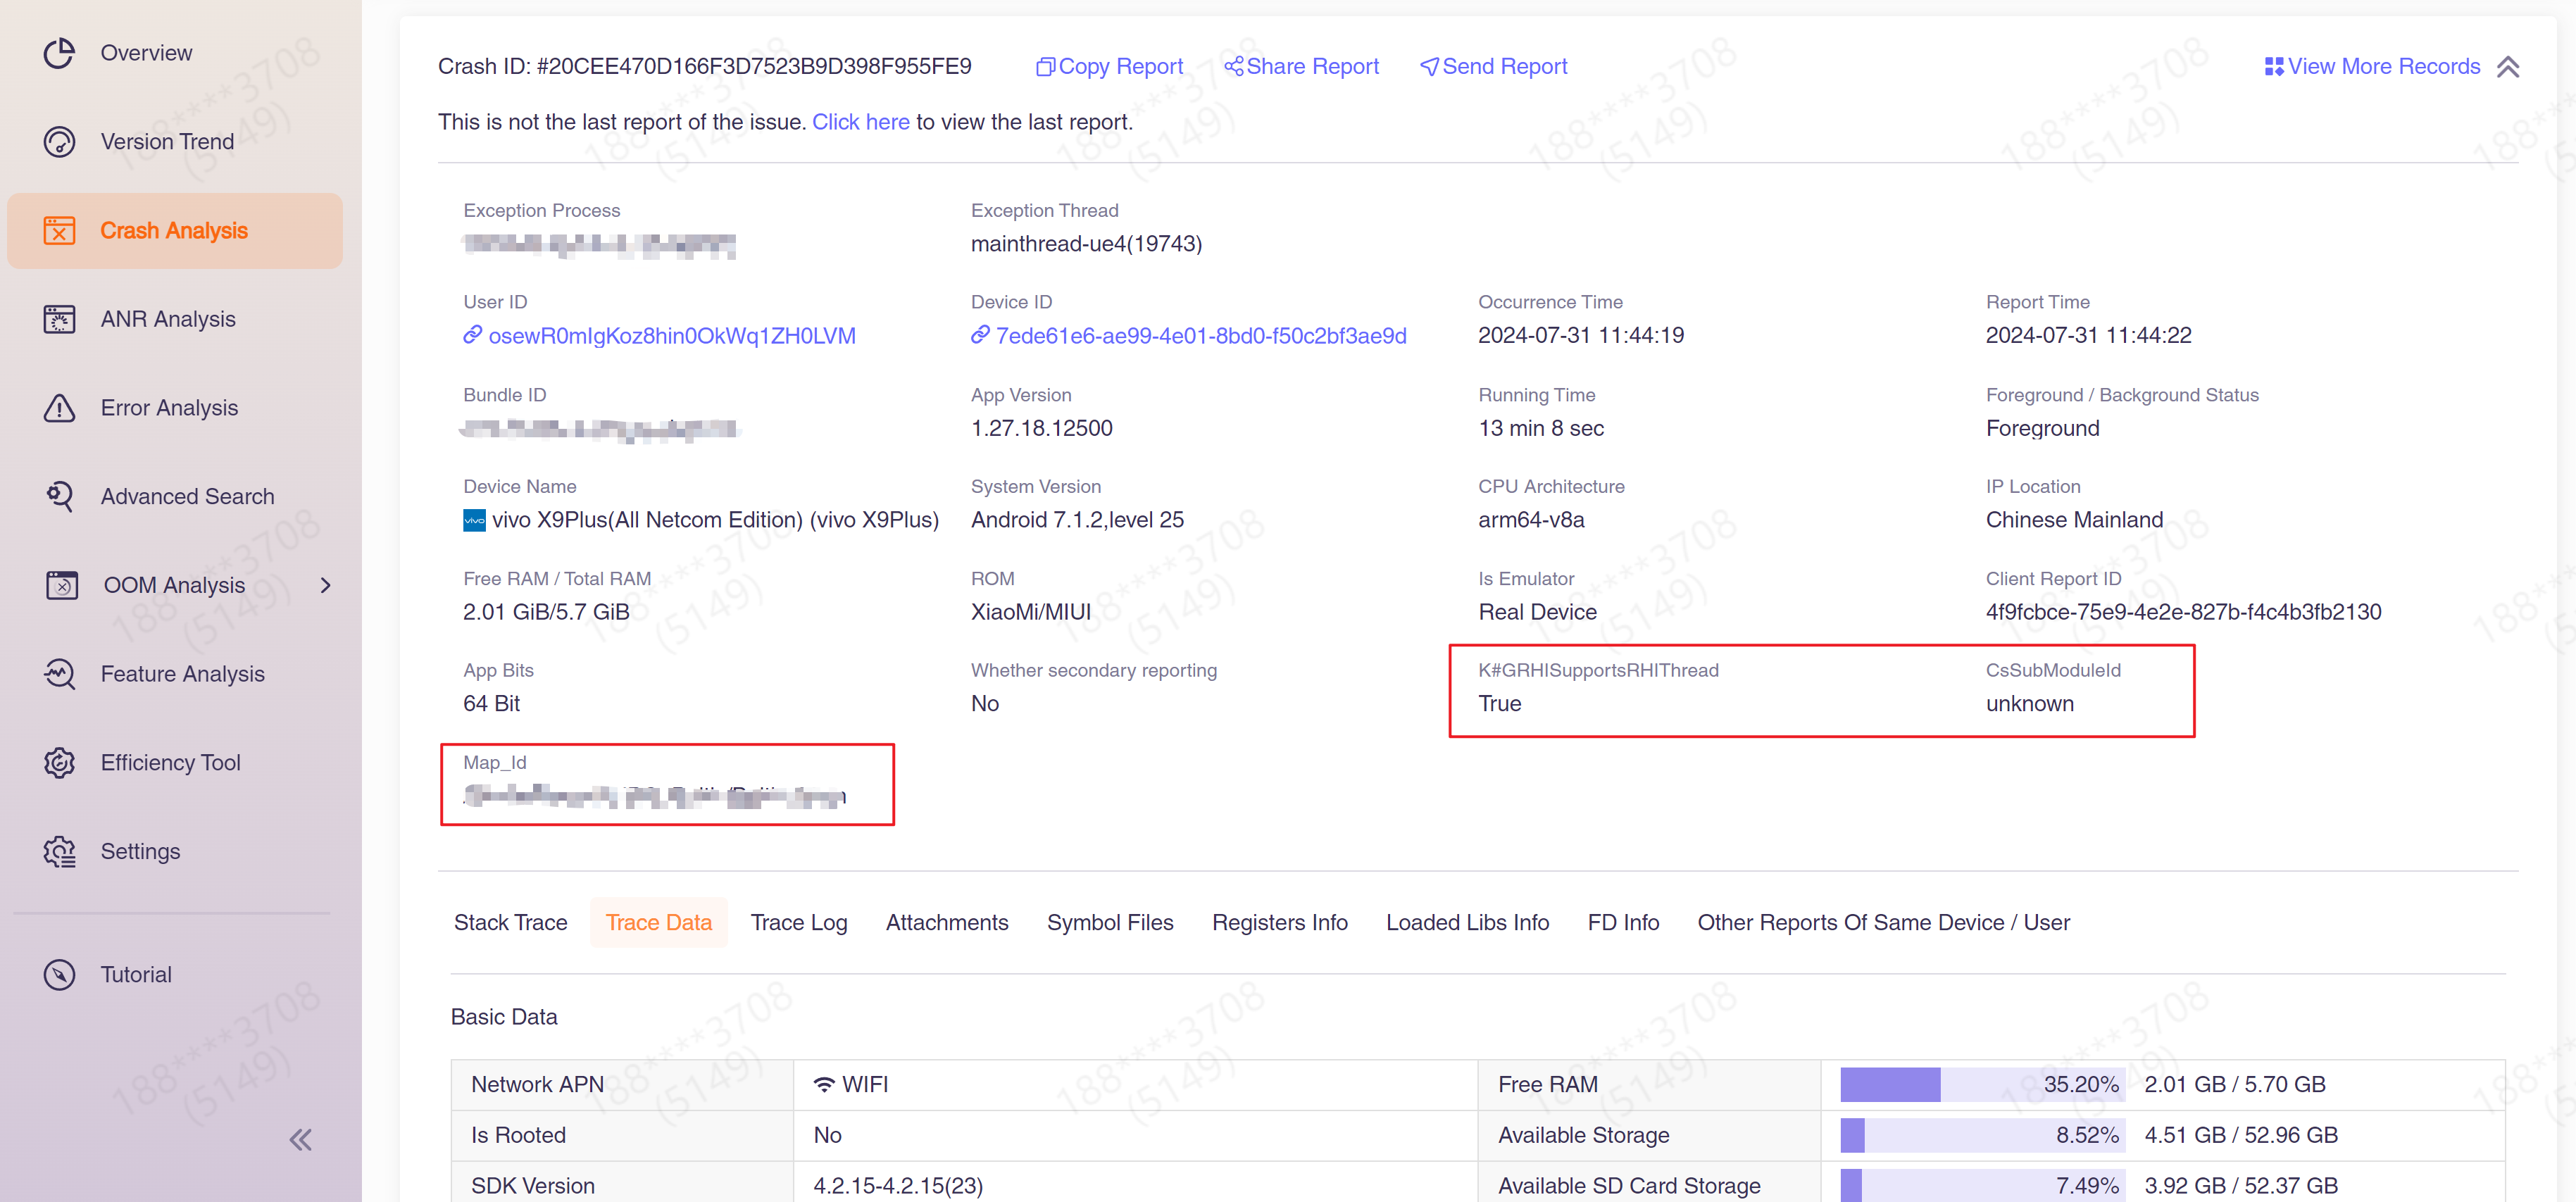
2.6 Report Details
The report details area displays the latest reported details by default. If you need to view more reported details, you can click "View More Records".
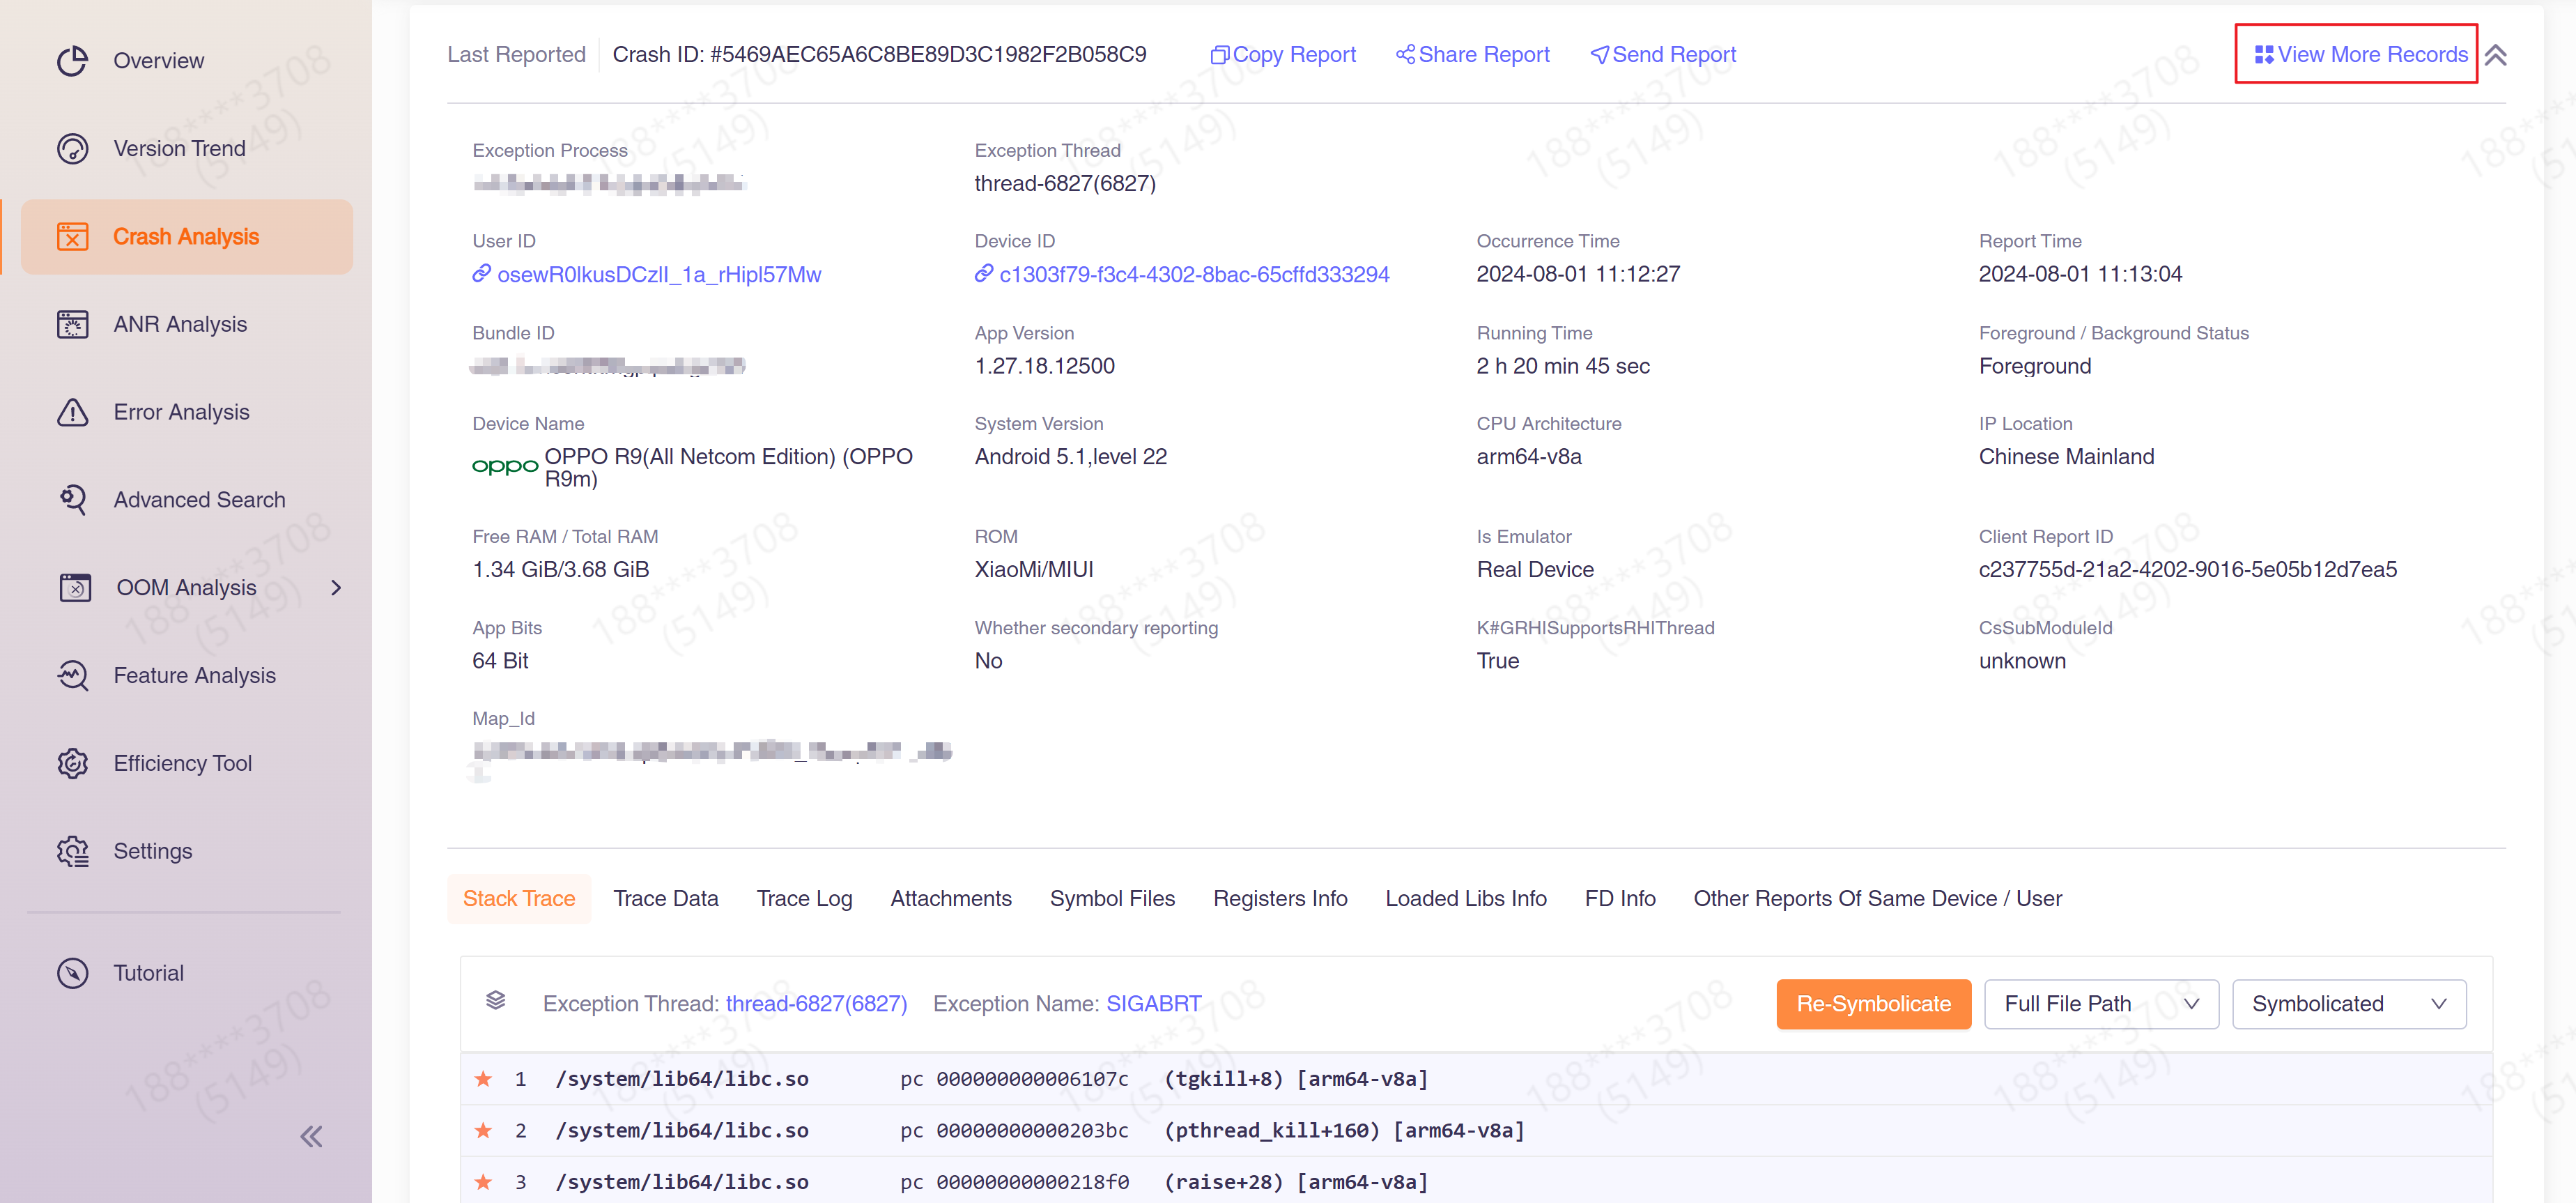
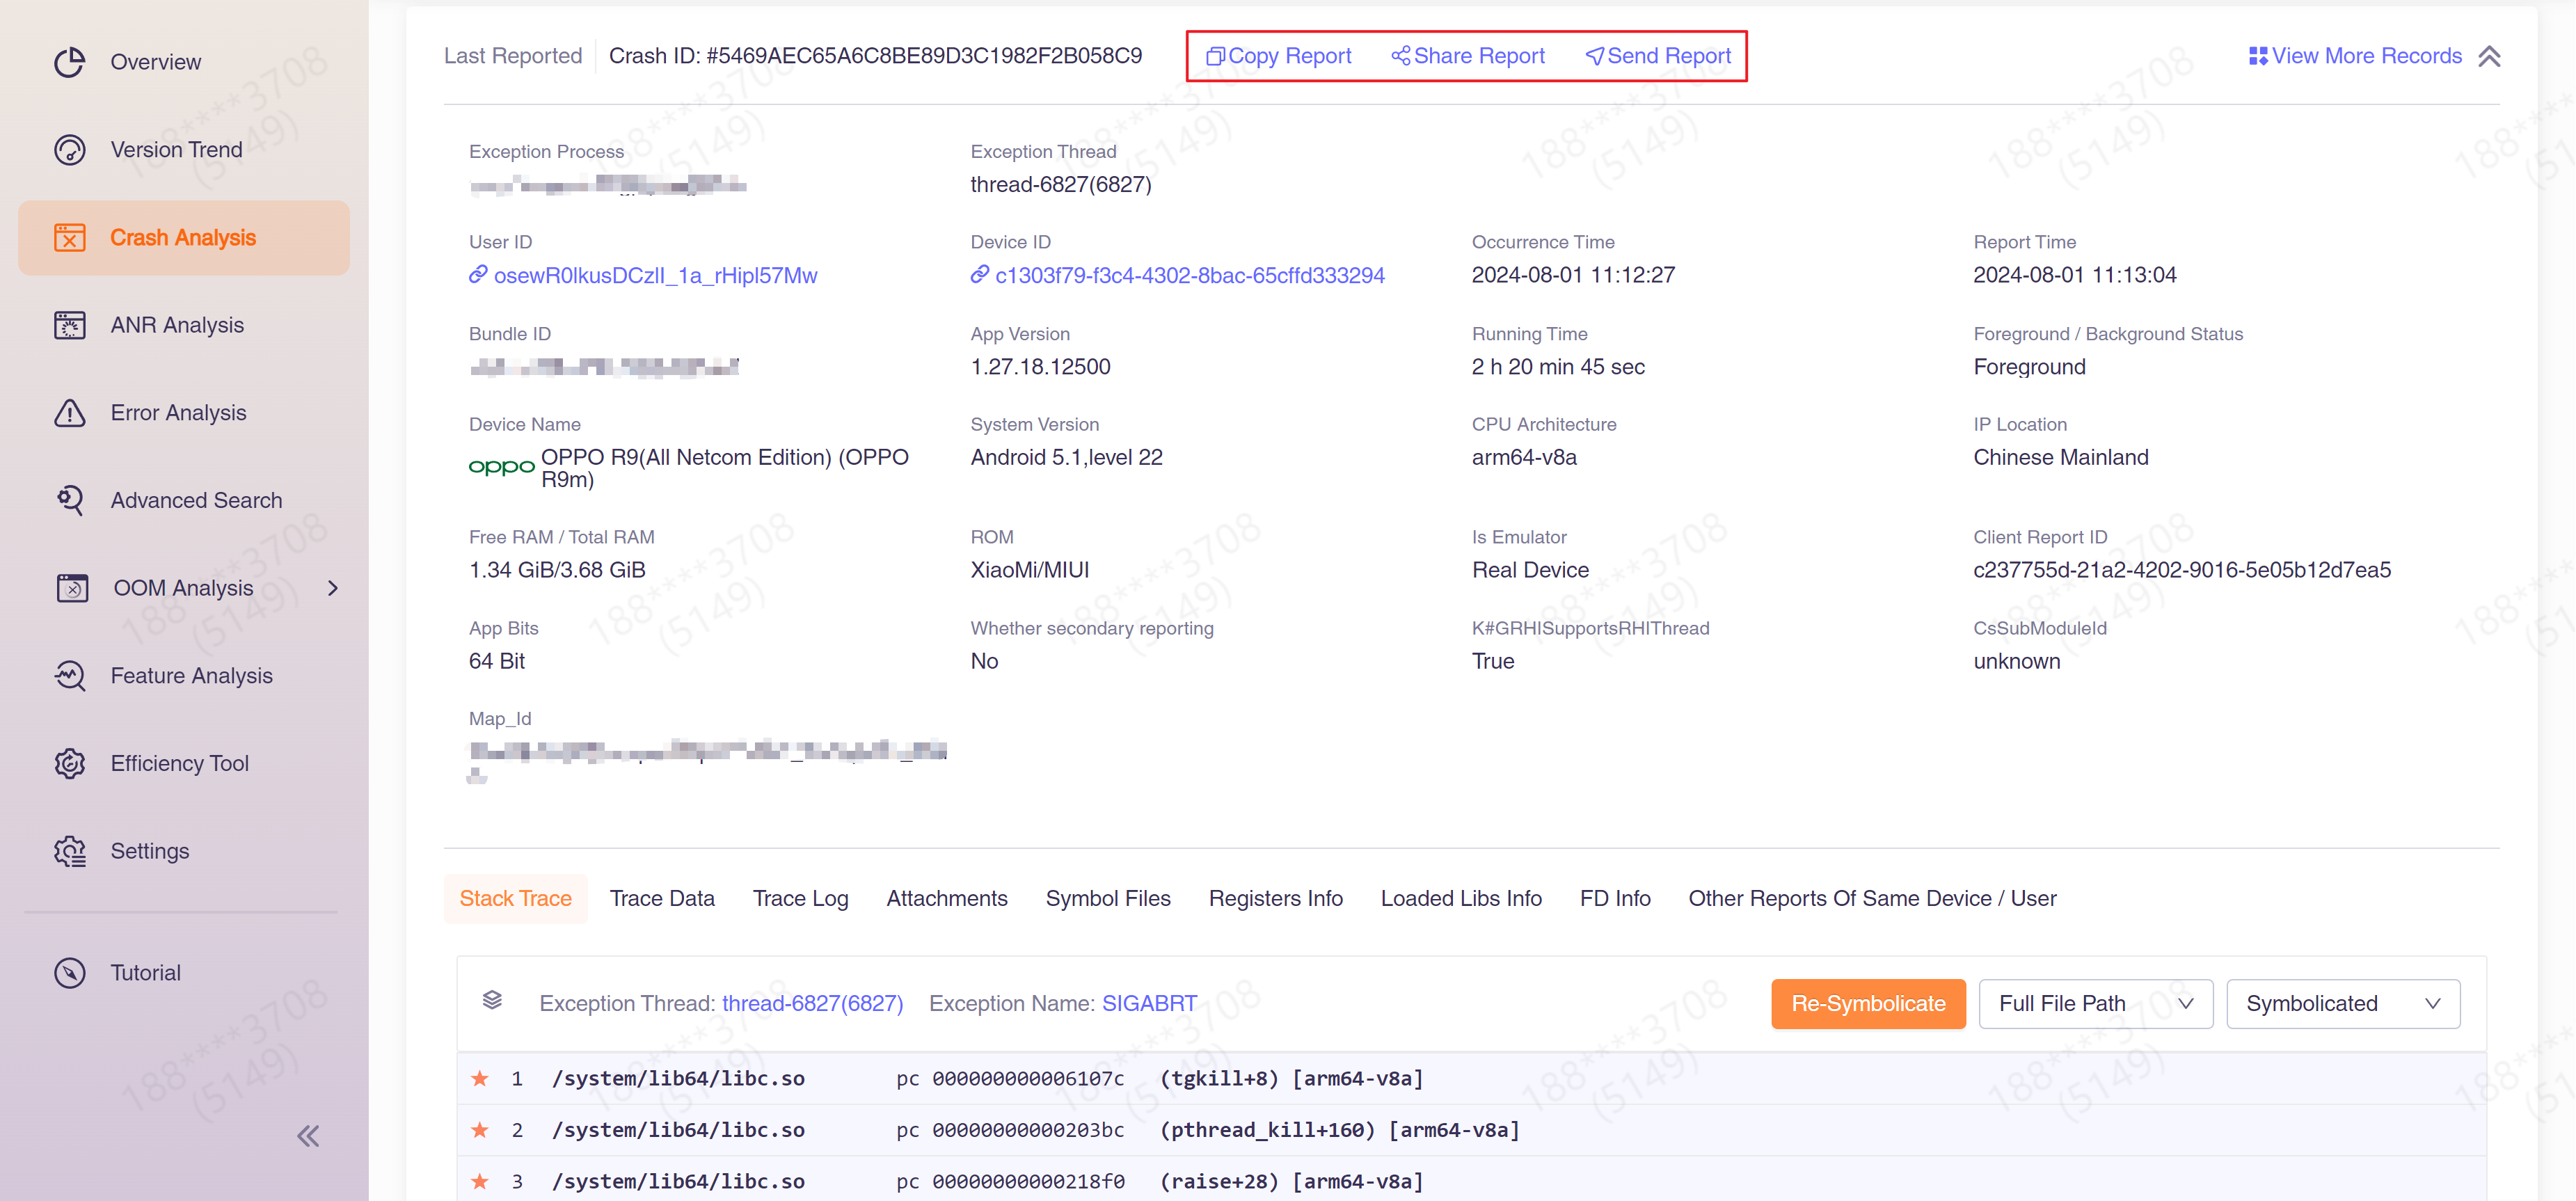
"Copy current report URL" can be used to share this report with project members. If you need to share reported information with non-project members, you can use "Generate anonymous share link", which will not expose other information about your project.
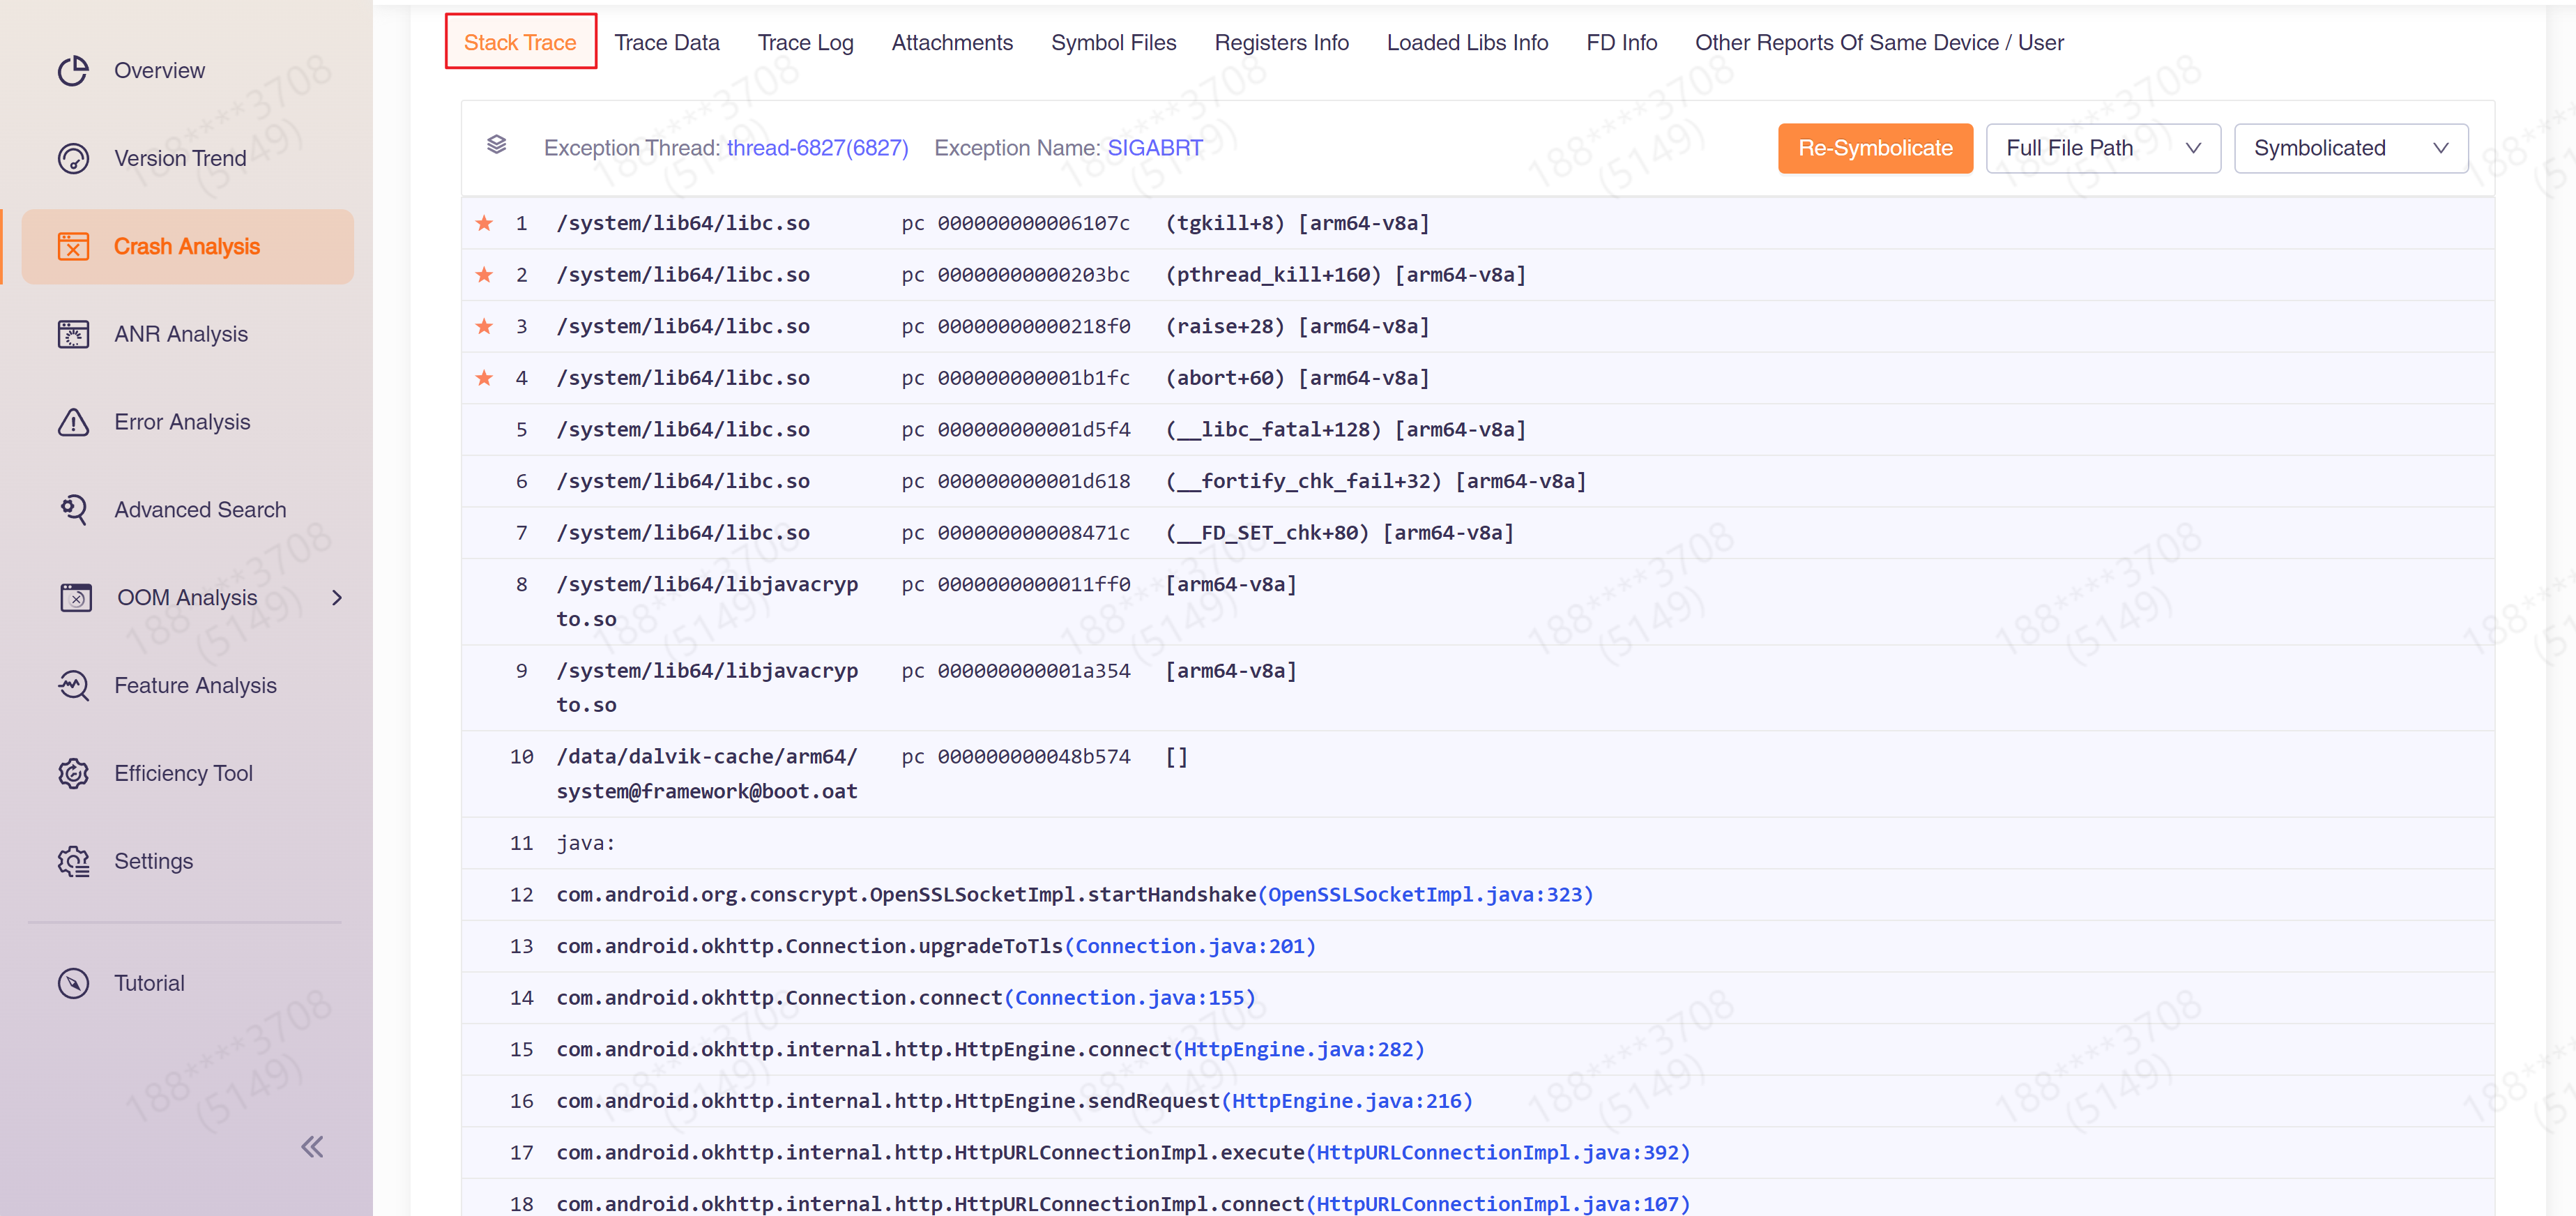
2.7 Error Stack
The Error Stack tab displays the error stack for the issue. Normally, the native crash stack needs to be symbolicated using the symbol table. To upload the symbol table, please refer to Symbol Table Tool Usage Introduction. Newly reported crashes will automatically start to be symbolicated. If you uploaded the symbol table after the crash was reported, please click "Retry Stack-Retrace" to manually trigger the symbolication.
2.8 Trace Data
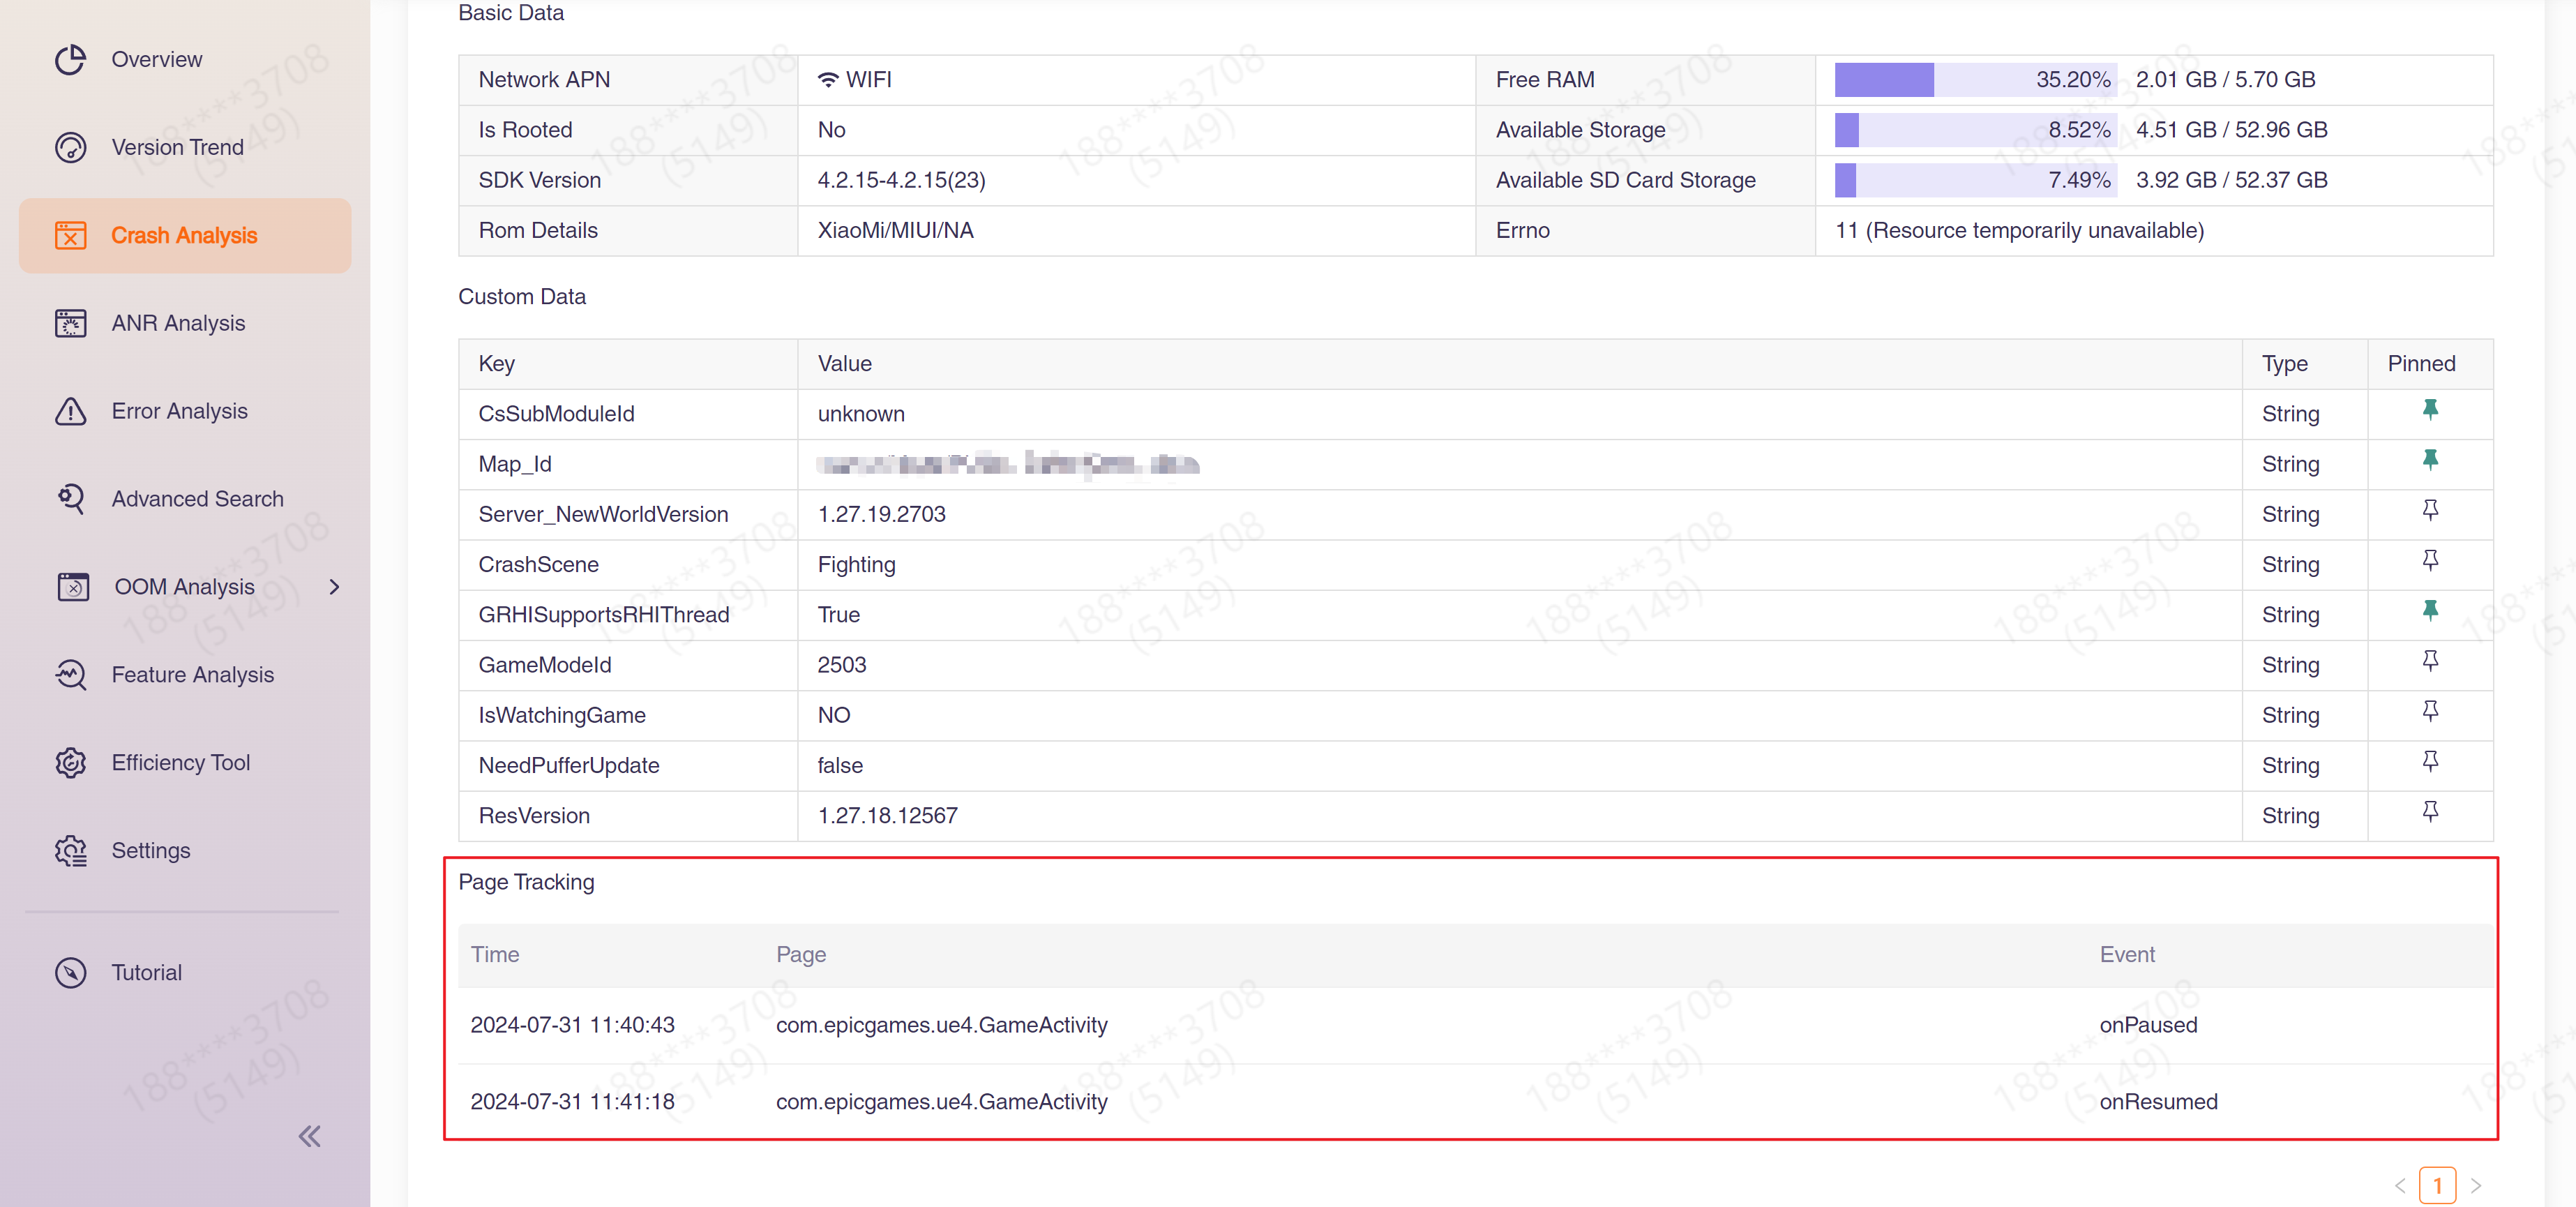
"Trace Data" displays some detailed data of the current issue and contains the following sections:
(1) "Basic data" includes some status parameters of the device.
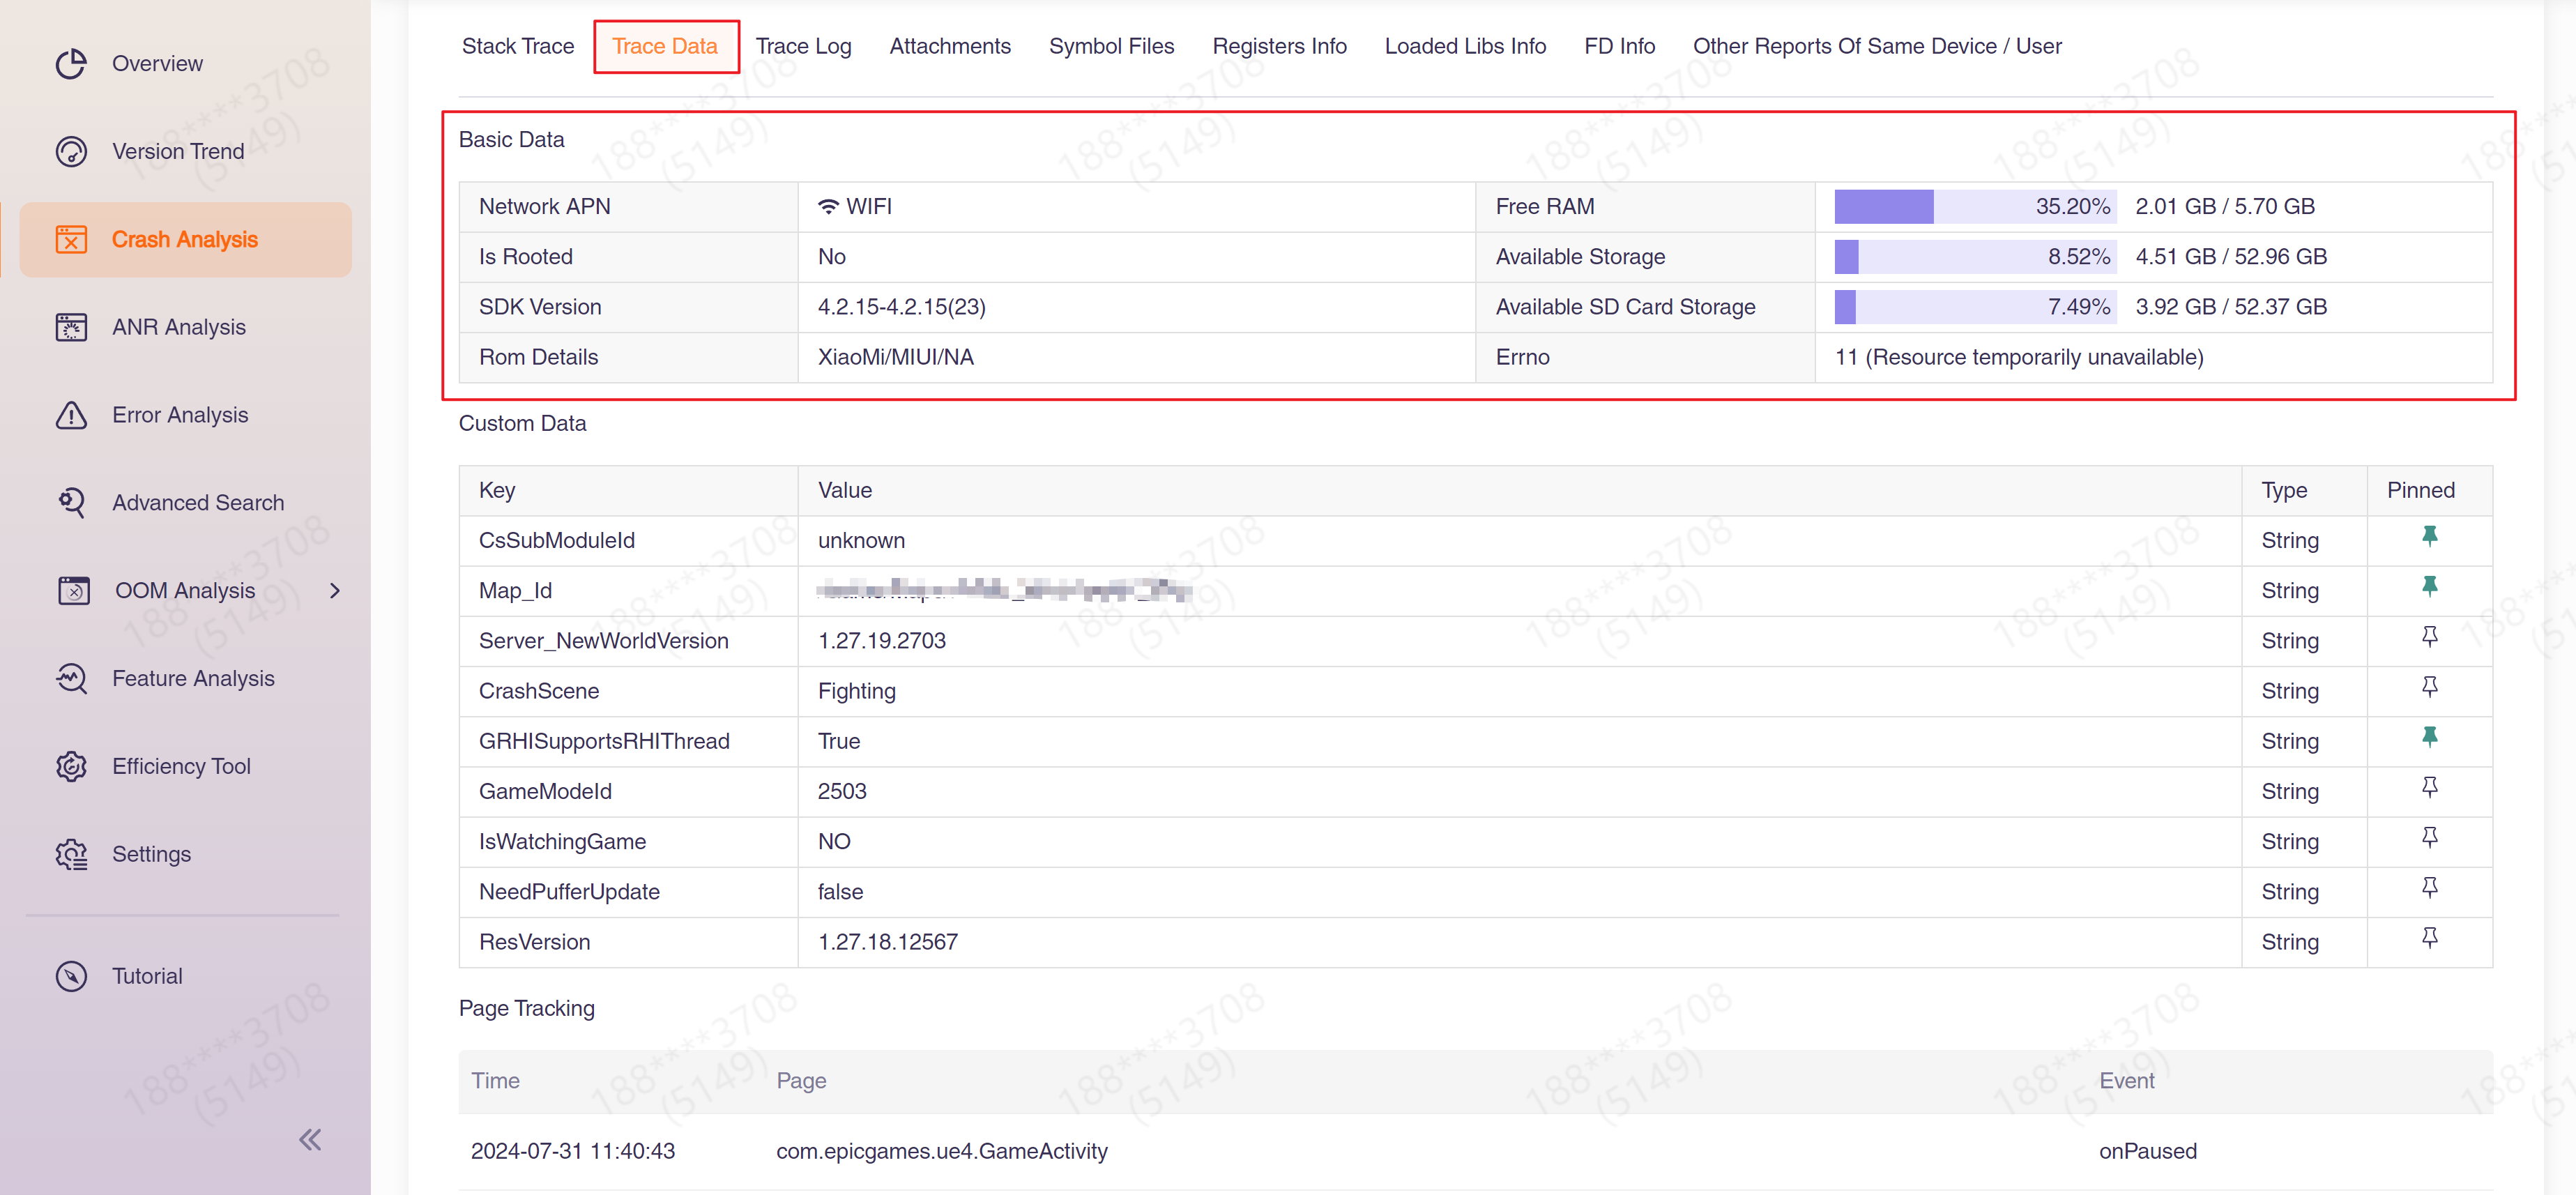
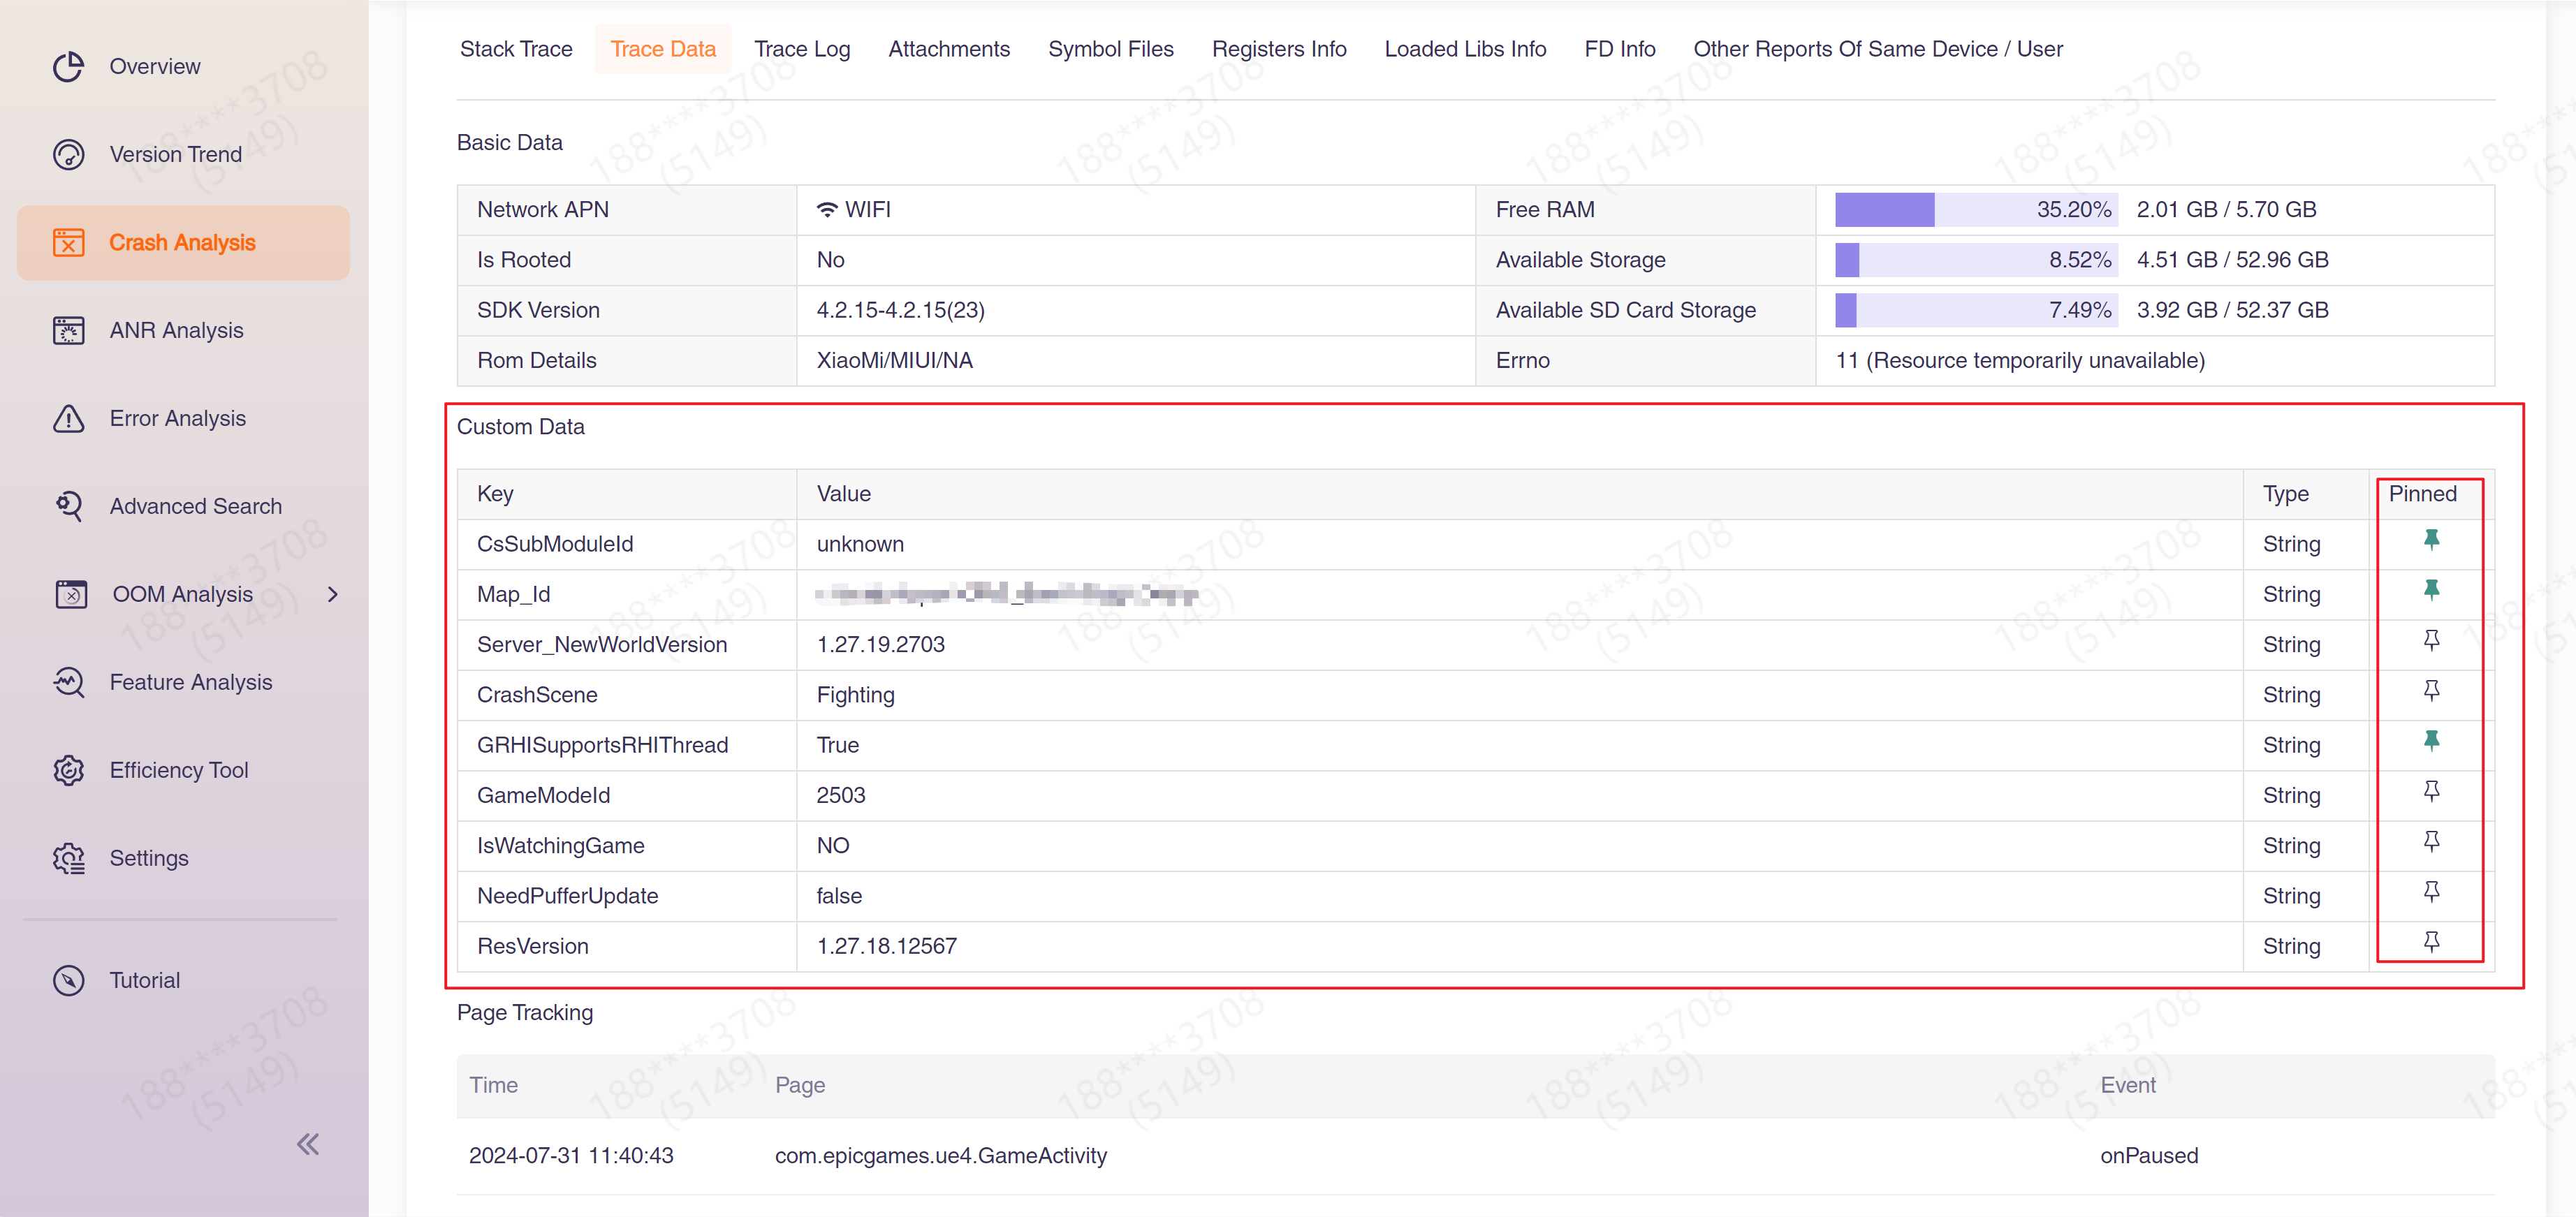
(2) "Custom data" is a key-value pair configured by you. For configuration methods, please refer to Add custom data (unity) and Add custom data (unreal). You can also set up quick display fields here so they appear directly in the Report Details area.
(3)"Page Tracking" shows the page switching of the application.
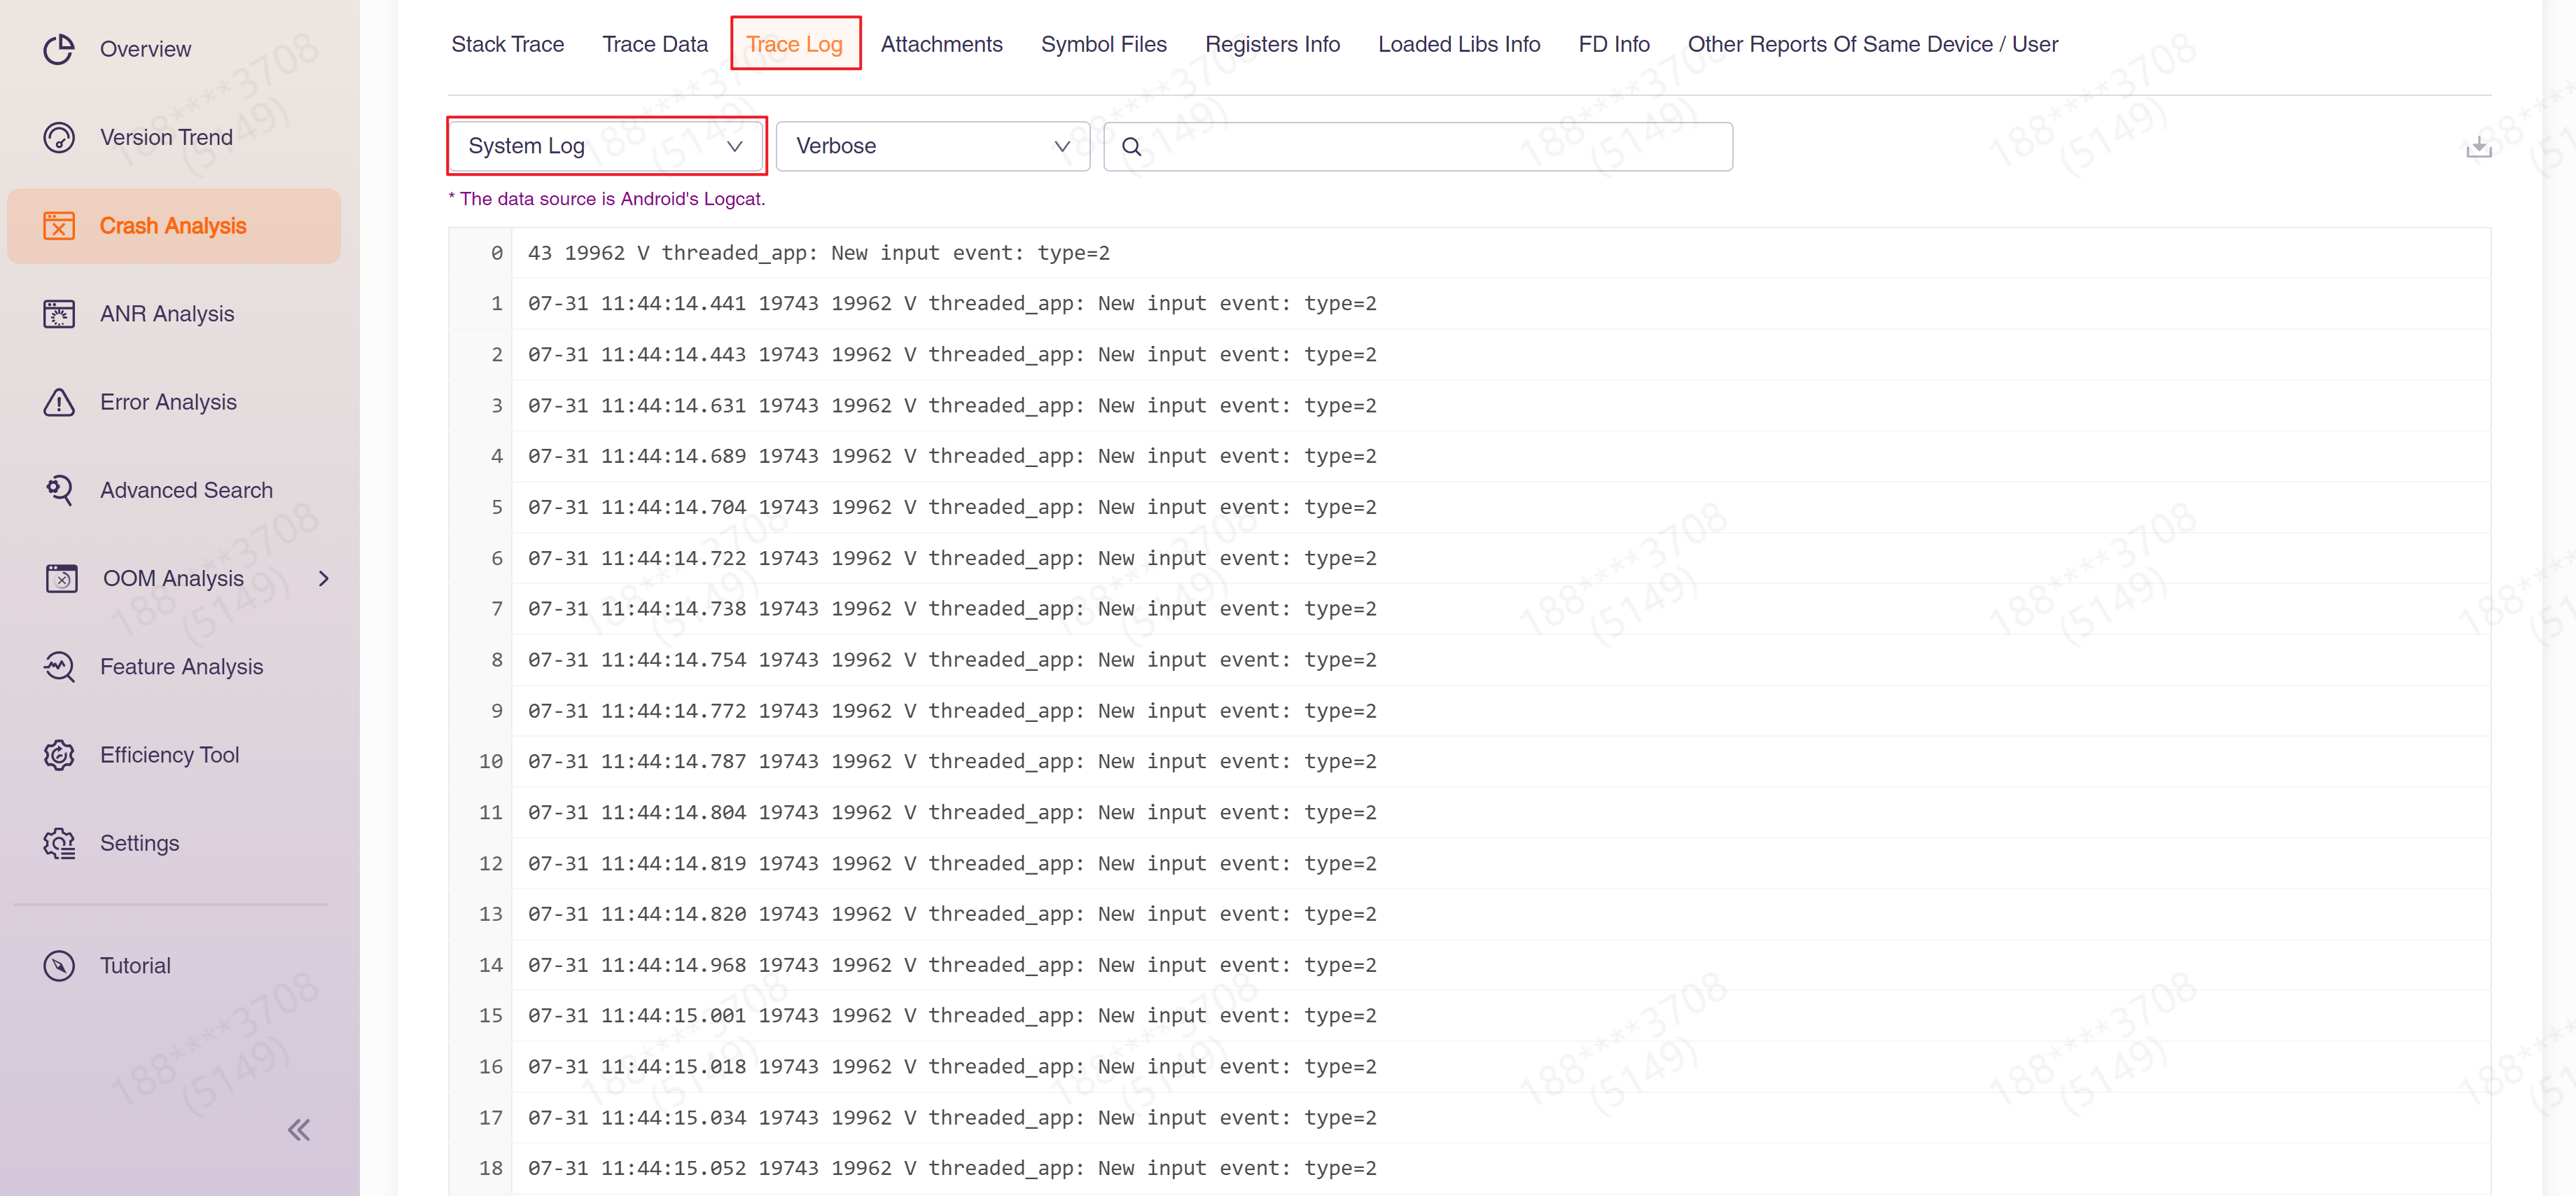
2.9 Trace Log
System logs and user-defined logs are displayed in "Trace Log". When switching to "System Log", the system log is displayed. Due to system limitations, this function is only available on Android.
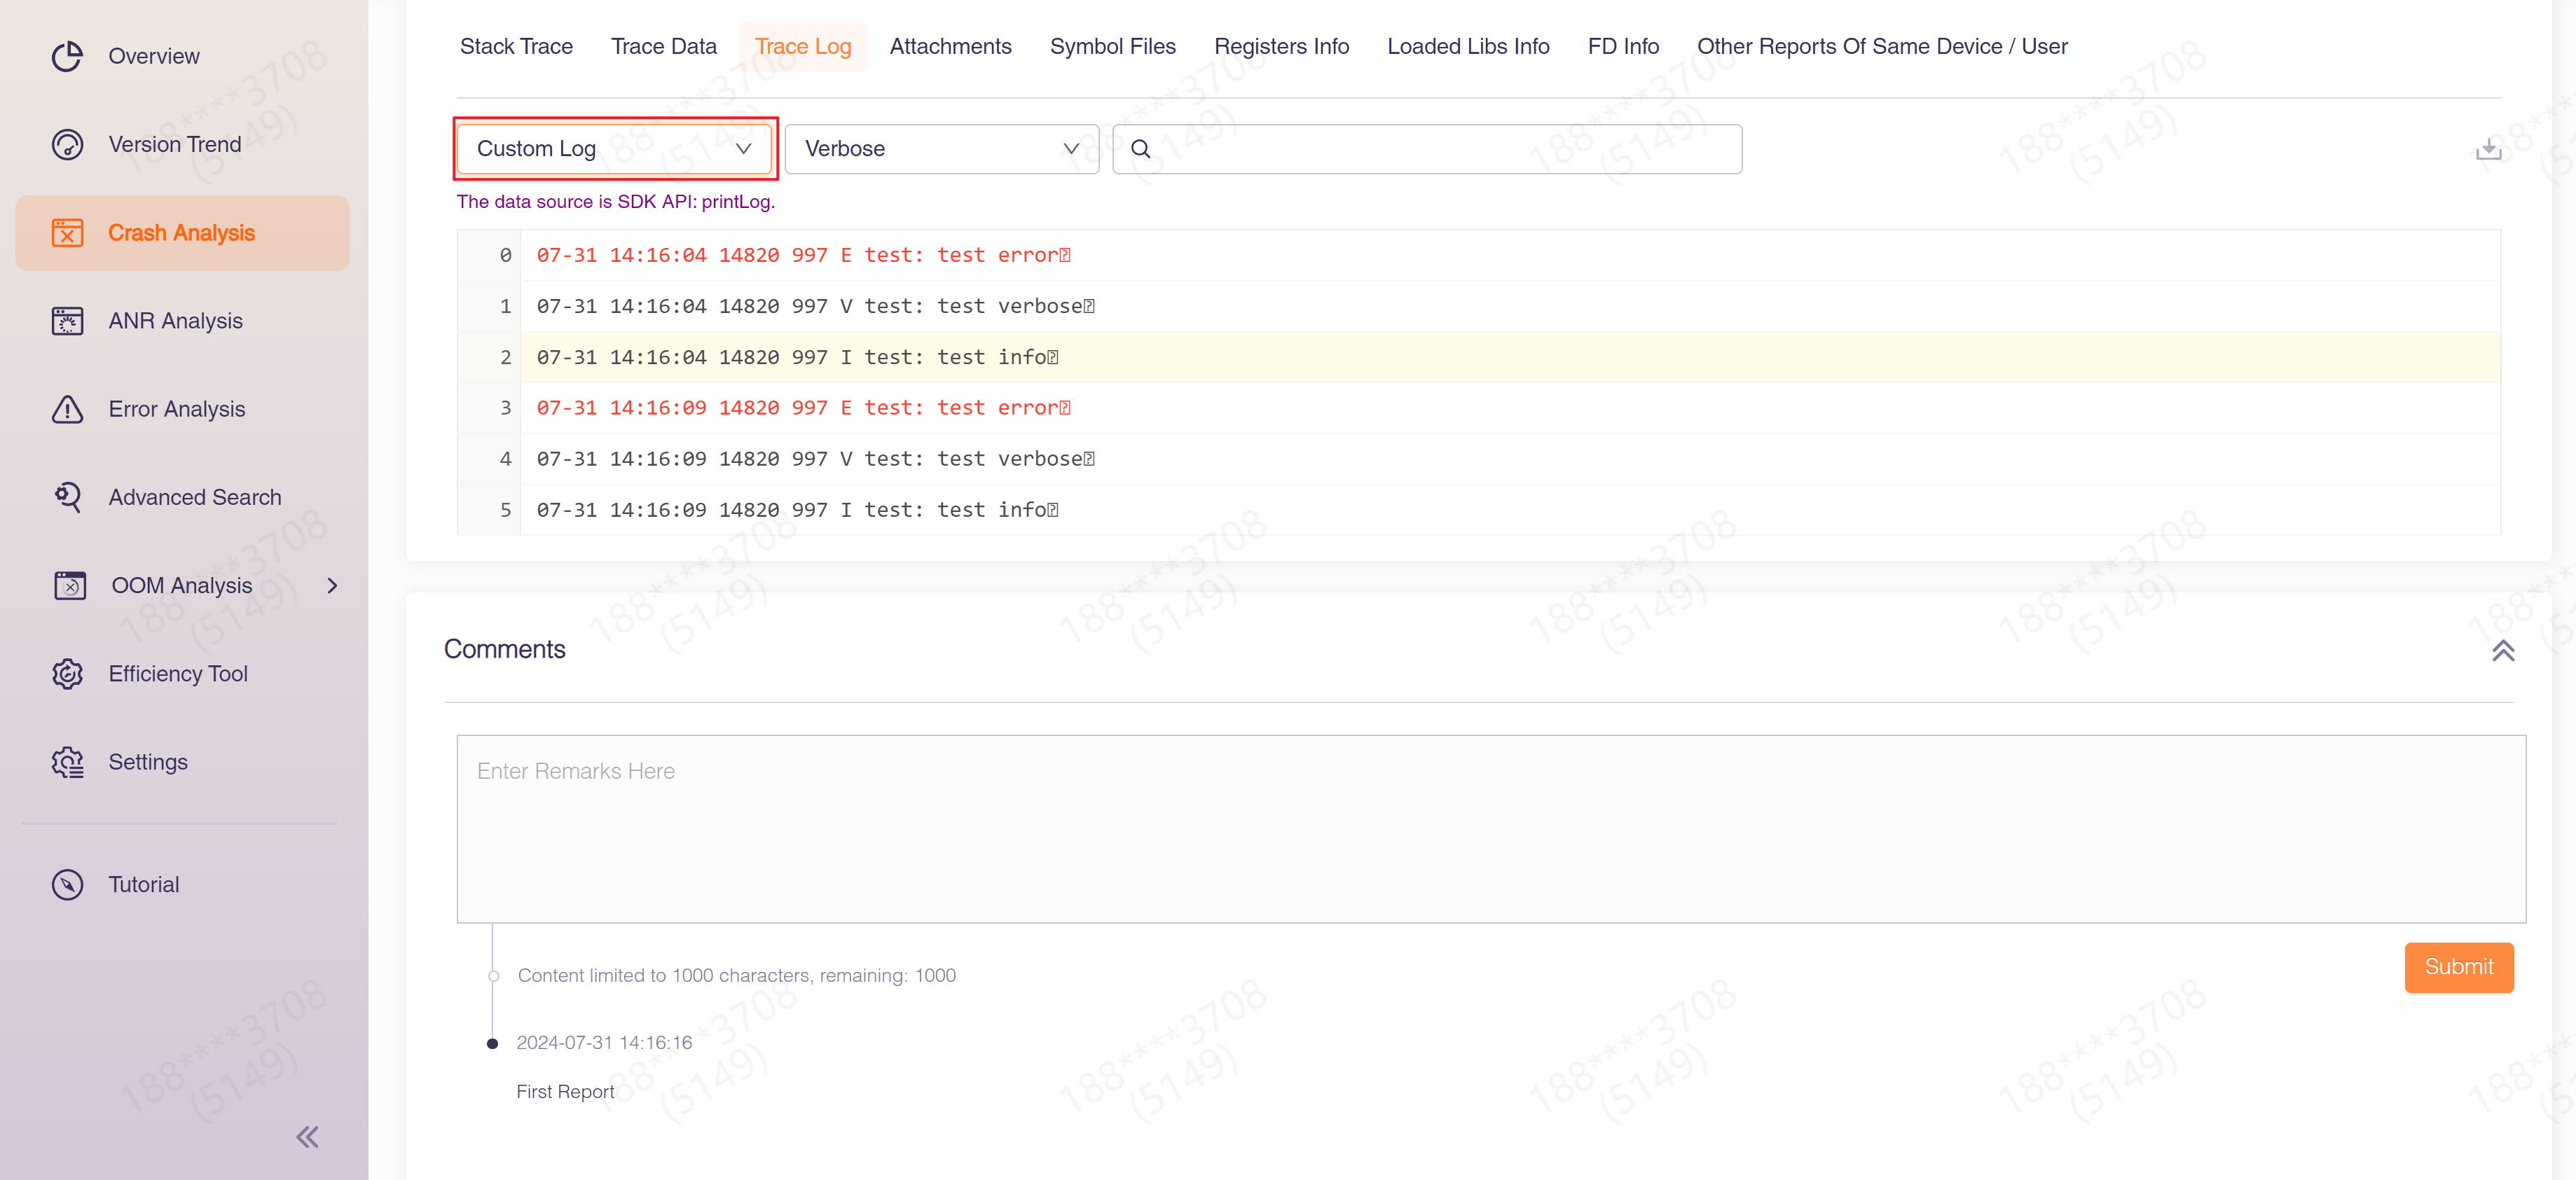
When switching to "Custom Log", the user-defined log is displayed. You can refer to Add Custom Log (unity) and Add Custom Log (unreal) to use this feature.
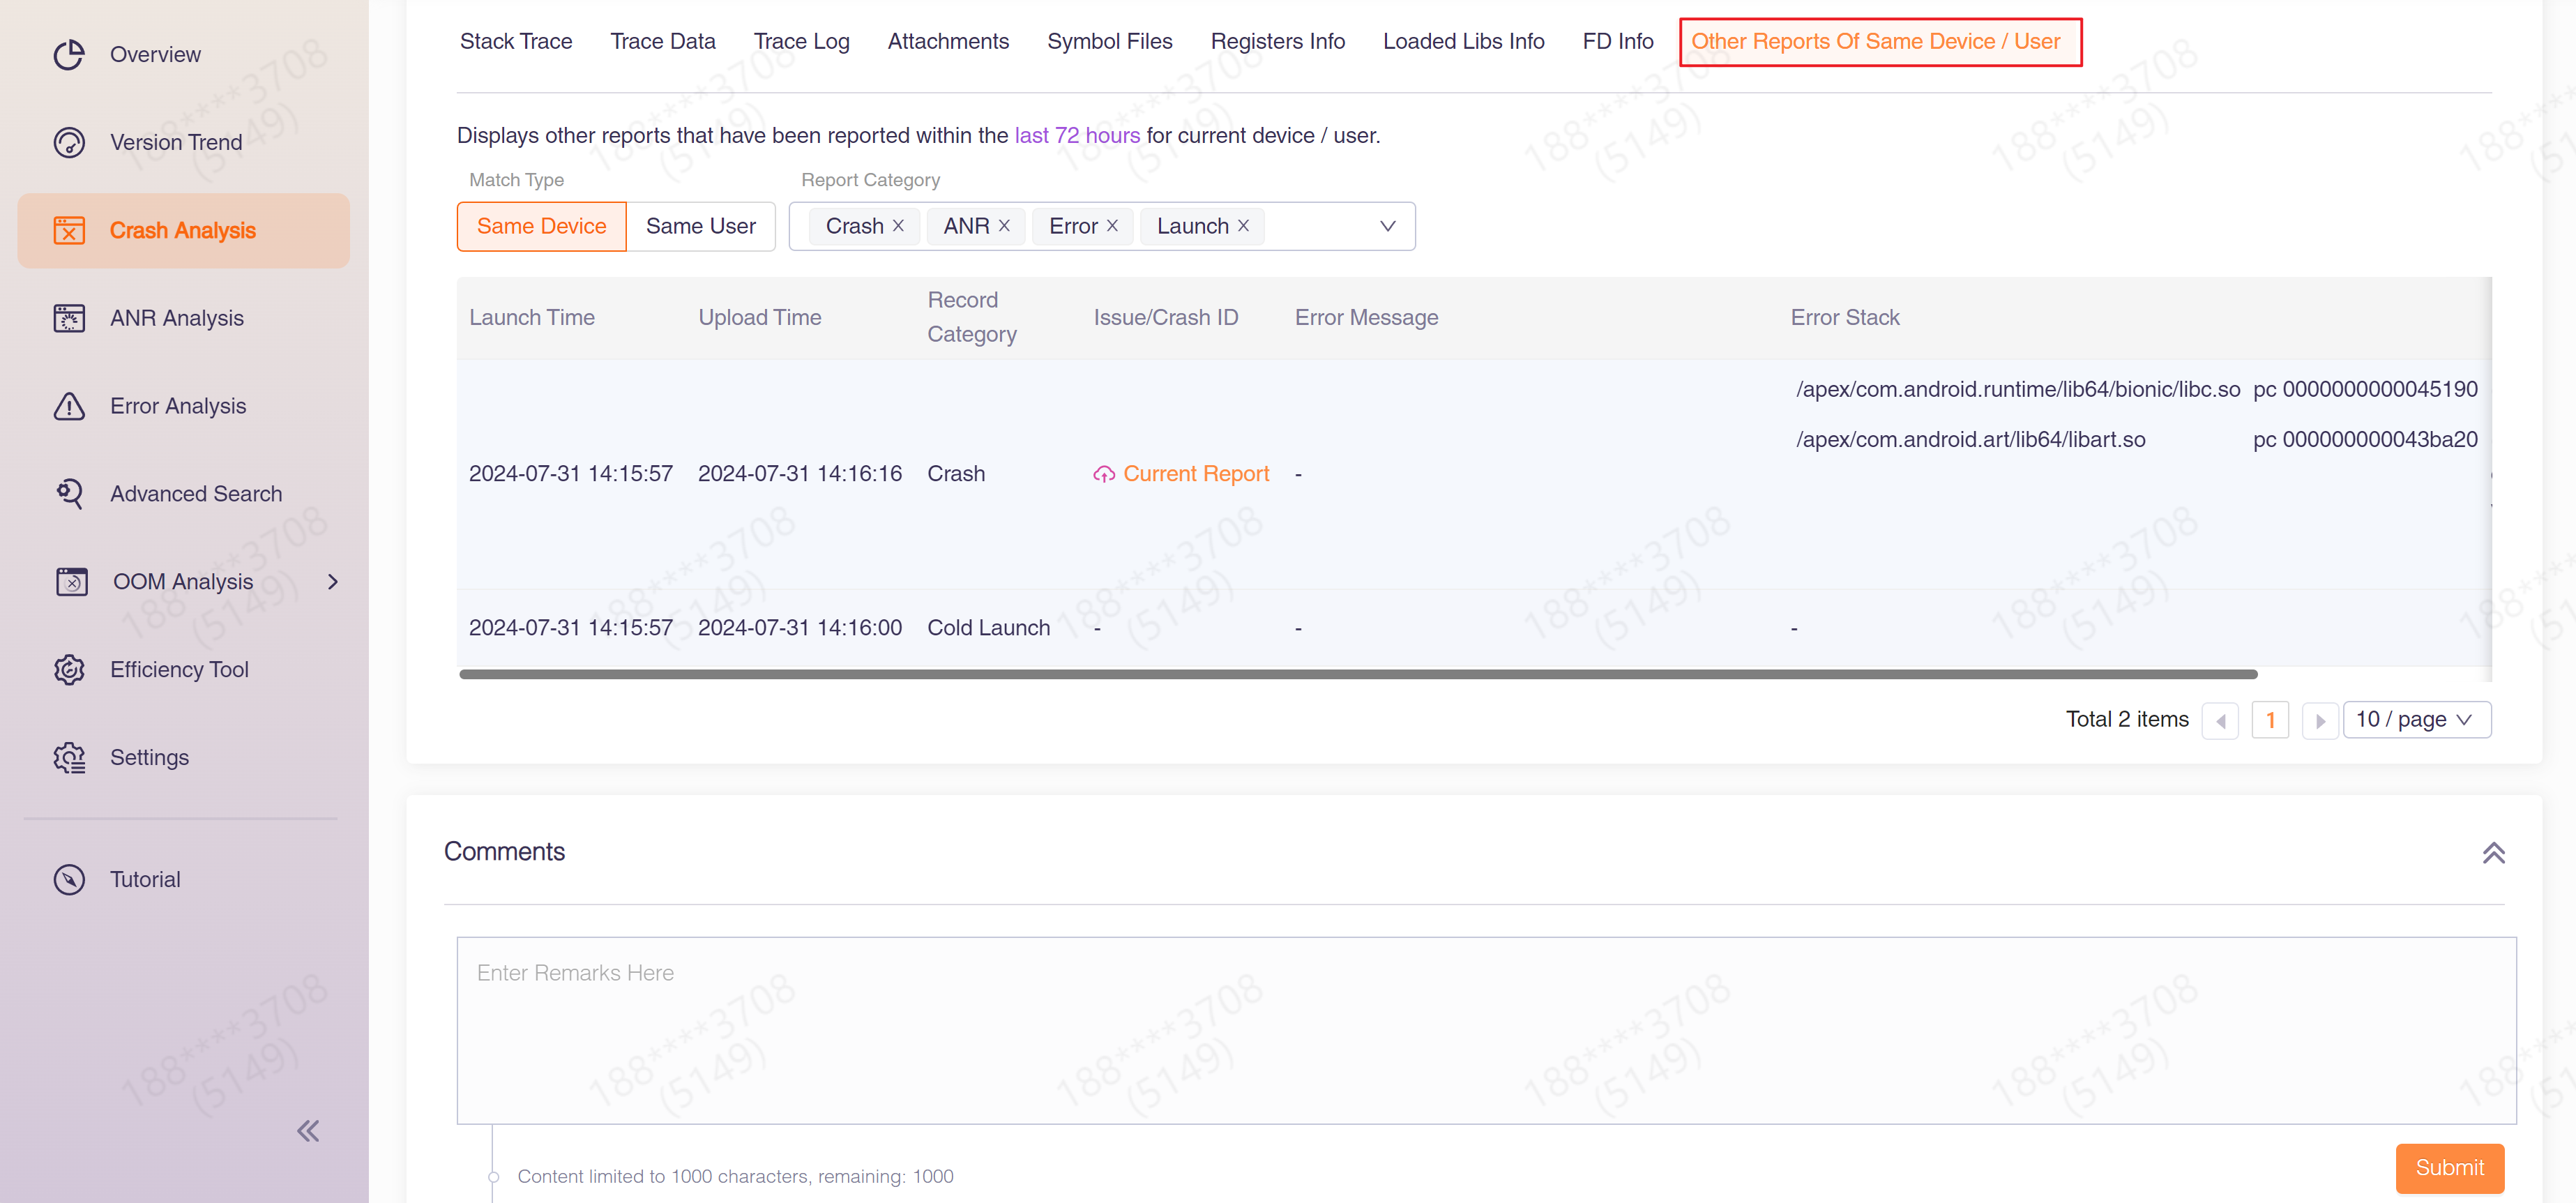
2.10 Other Reports Of Same Device / User
"Other Reports Of Same Device / User" displays all reports within 3 days by the device or user that currently meets the issue. You can analyze the behavior of a specific user or device based on this.
3 Crash Analysis
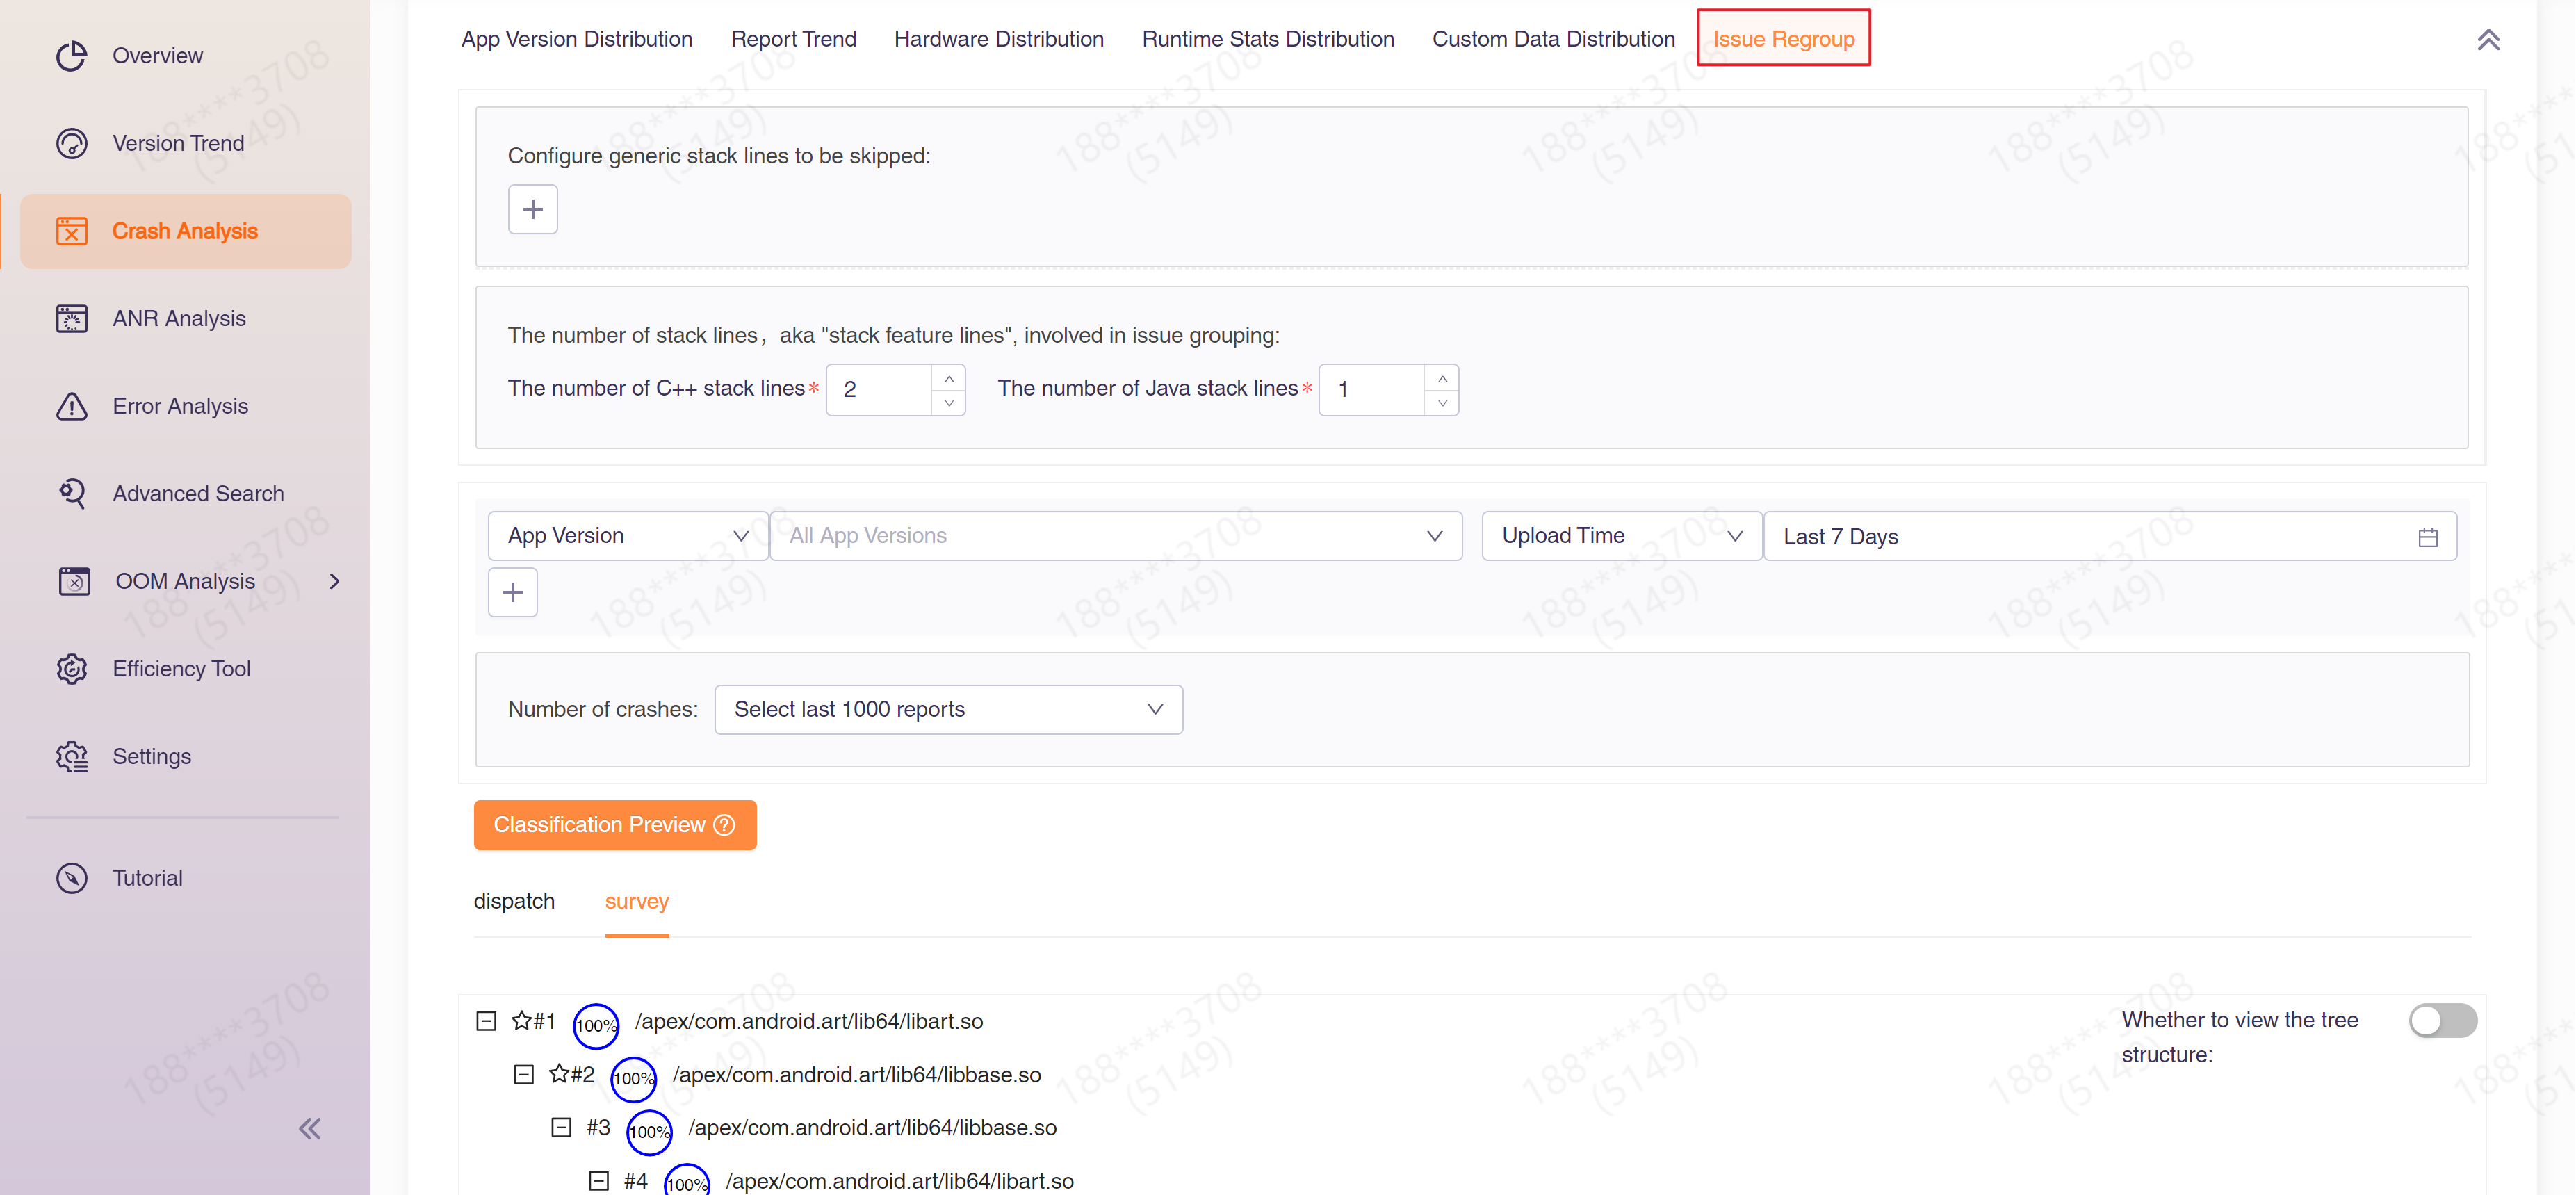
3.1 Issue Regroup
"Issue Regroup" provides the function of regrouping issues. By default, CrashSight uses the first two lines of the stack as the basis for issue classification. If you are not satisfied with CrashSight's automatic issue classification, you can configure the stack keywords that need to be skipped in this tab, as well as the number of stack lines involved in issue classification, by adjusting these parameters to achieve more precise classification.
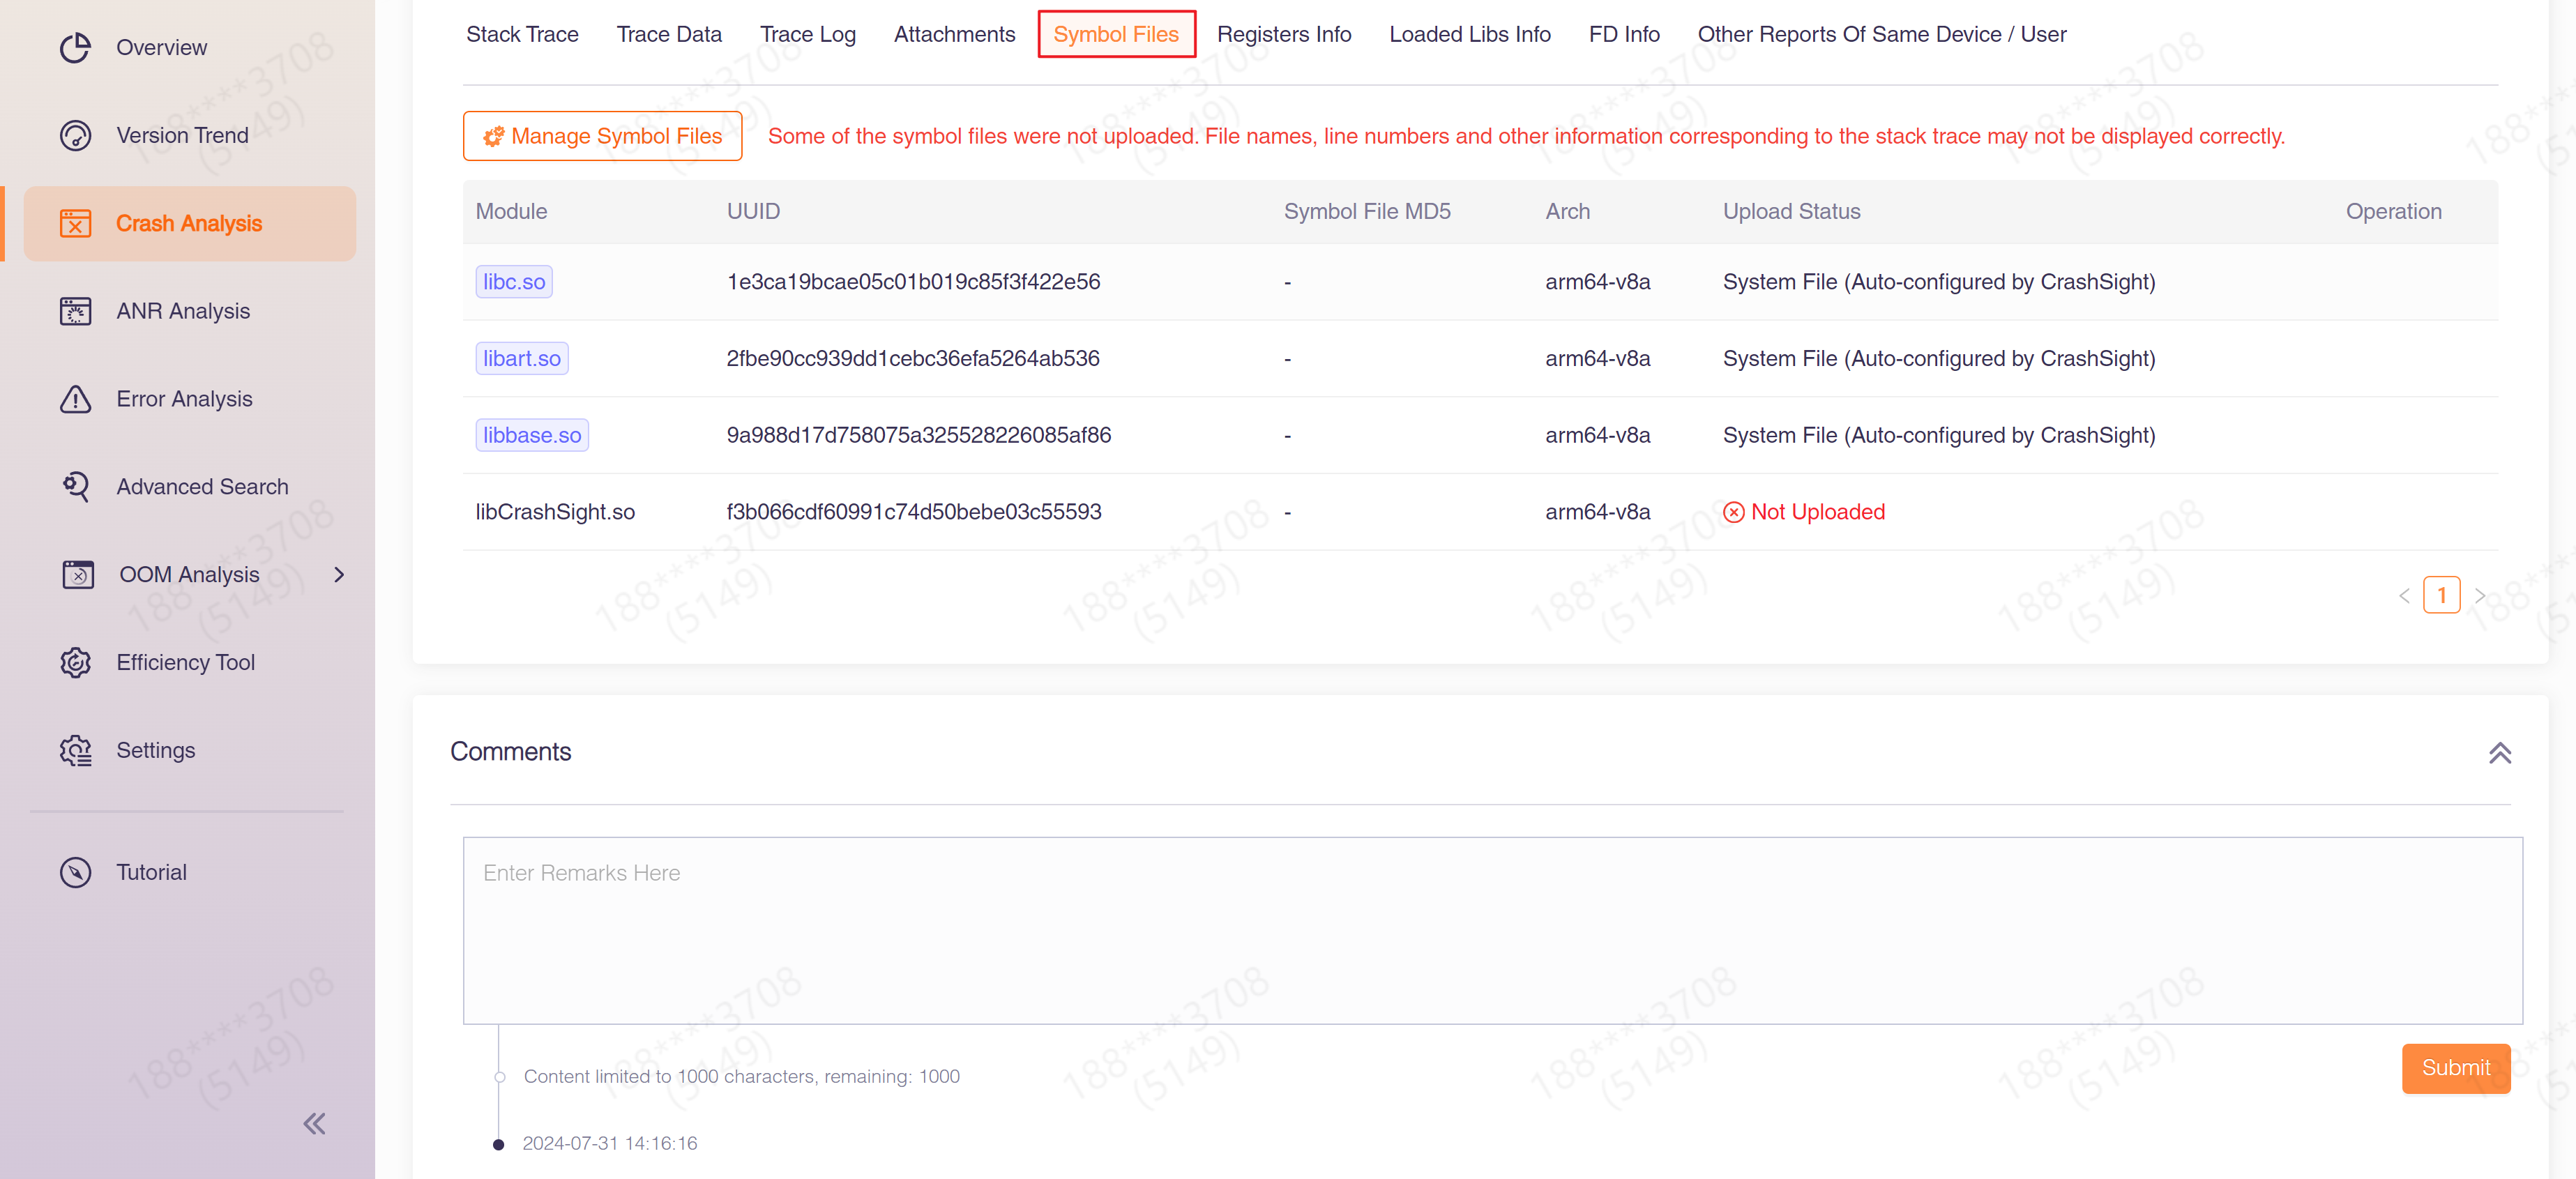
3.2 Symbol File
"Symbol File" displays the symbol table that needs to be used to symbolicate the current crashed stack. You can view the module names corresponding to the symbol tables and their upload status.
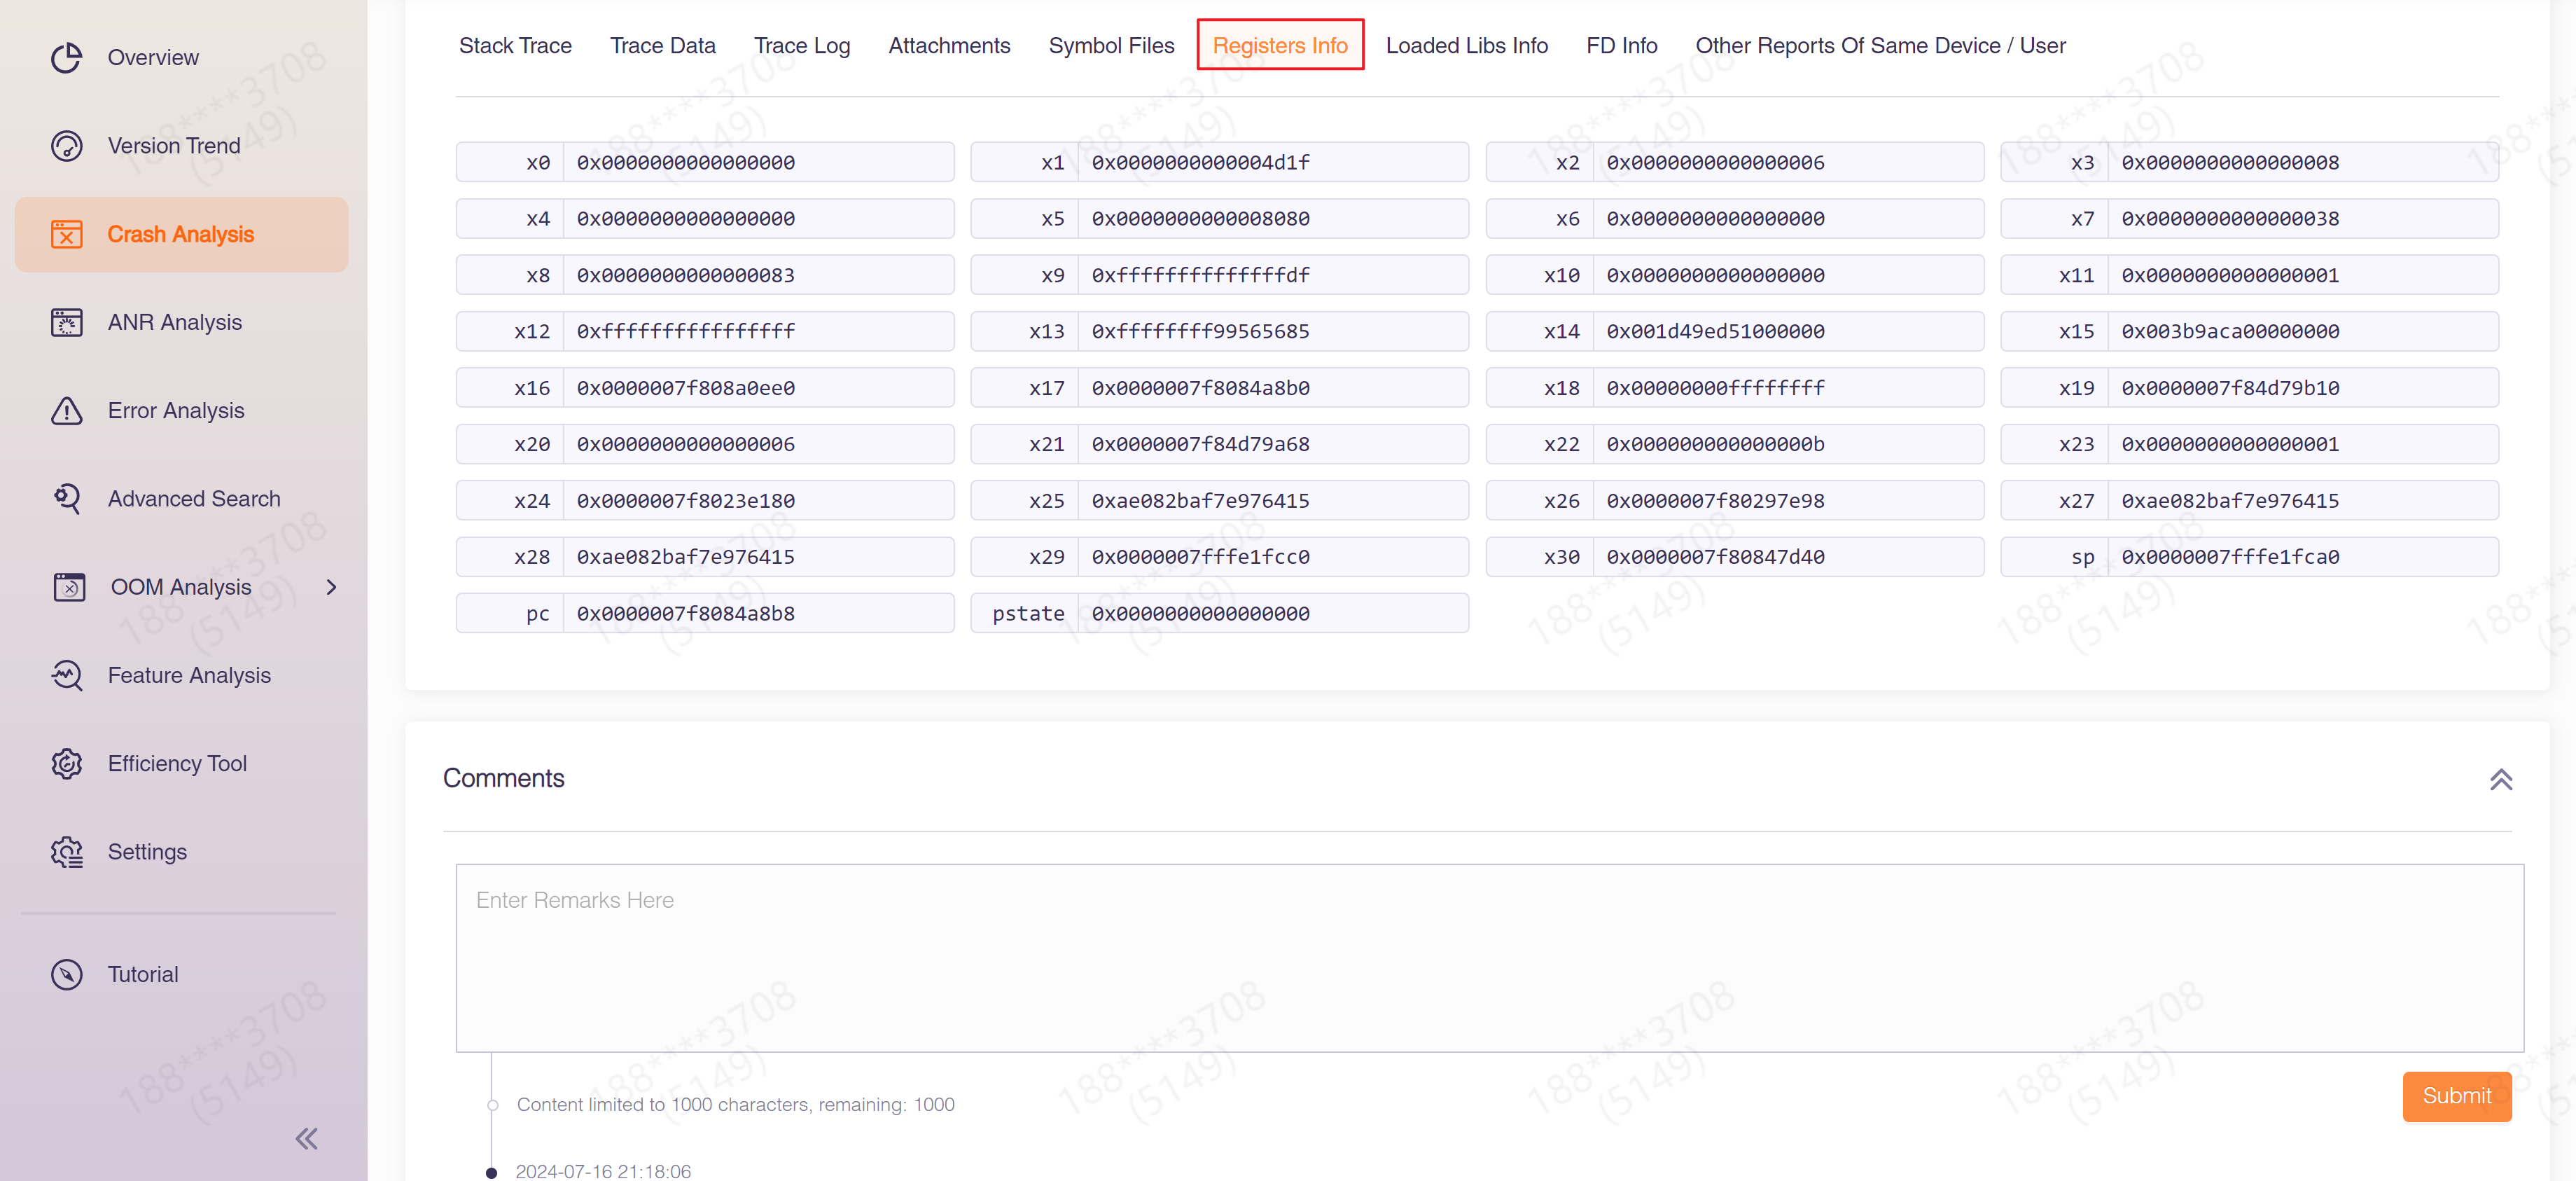
3.3 Registers Info
"Registers Info" shows the register value of the crashed thread when the crash occurred.
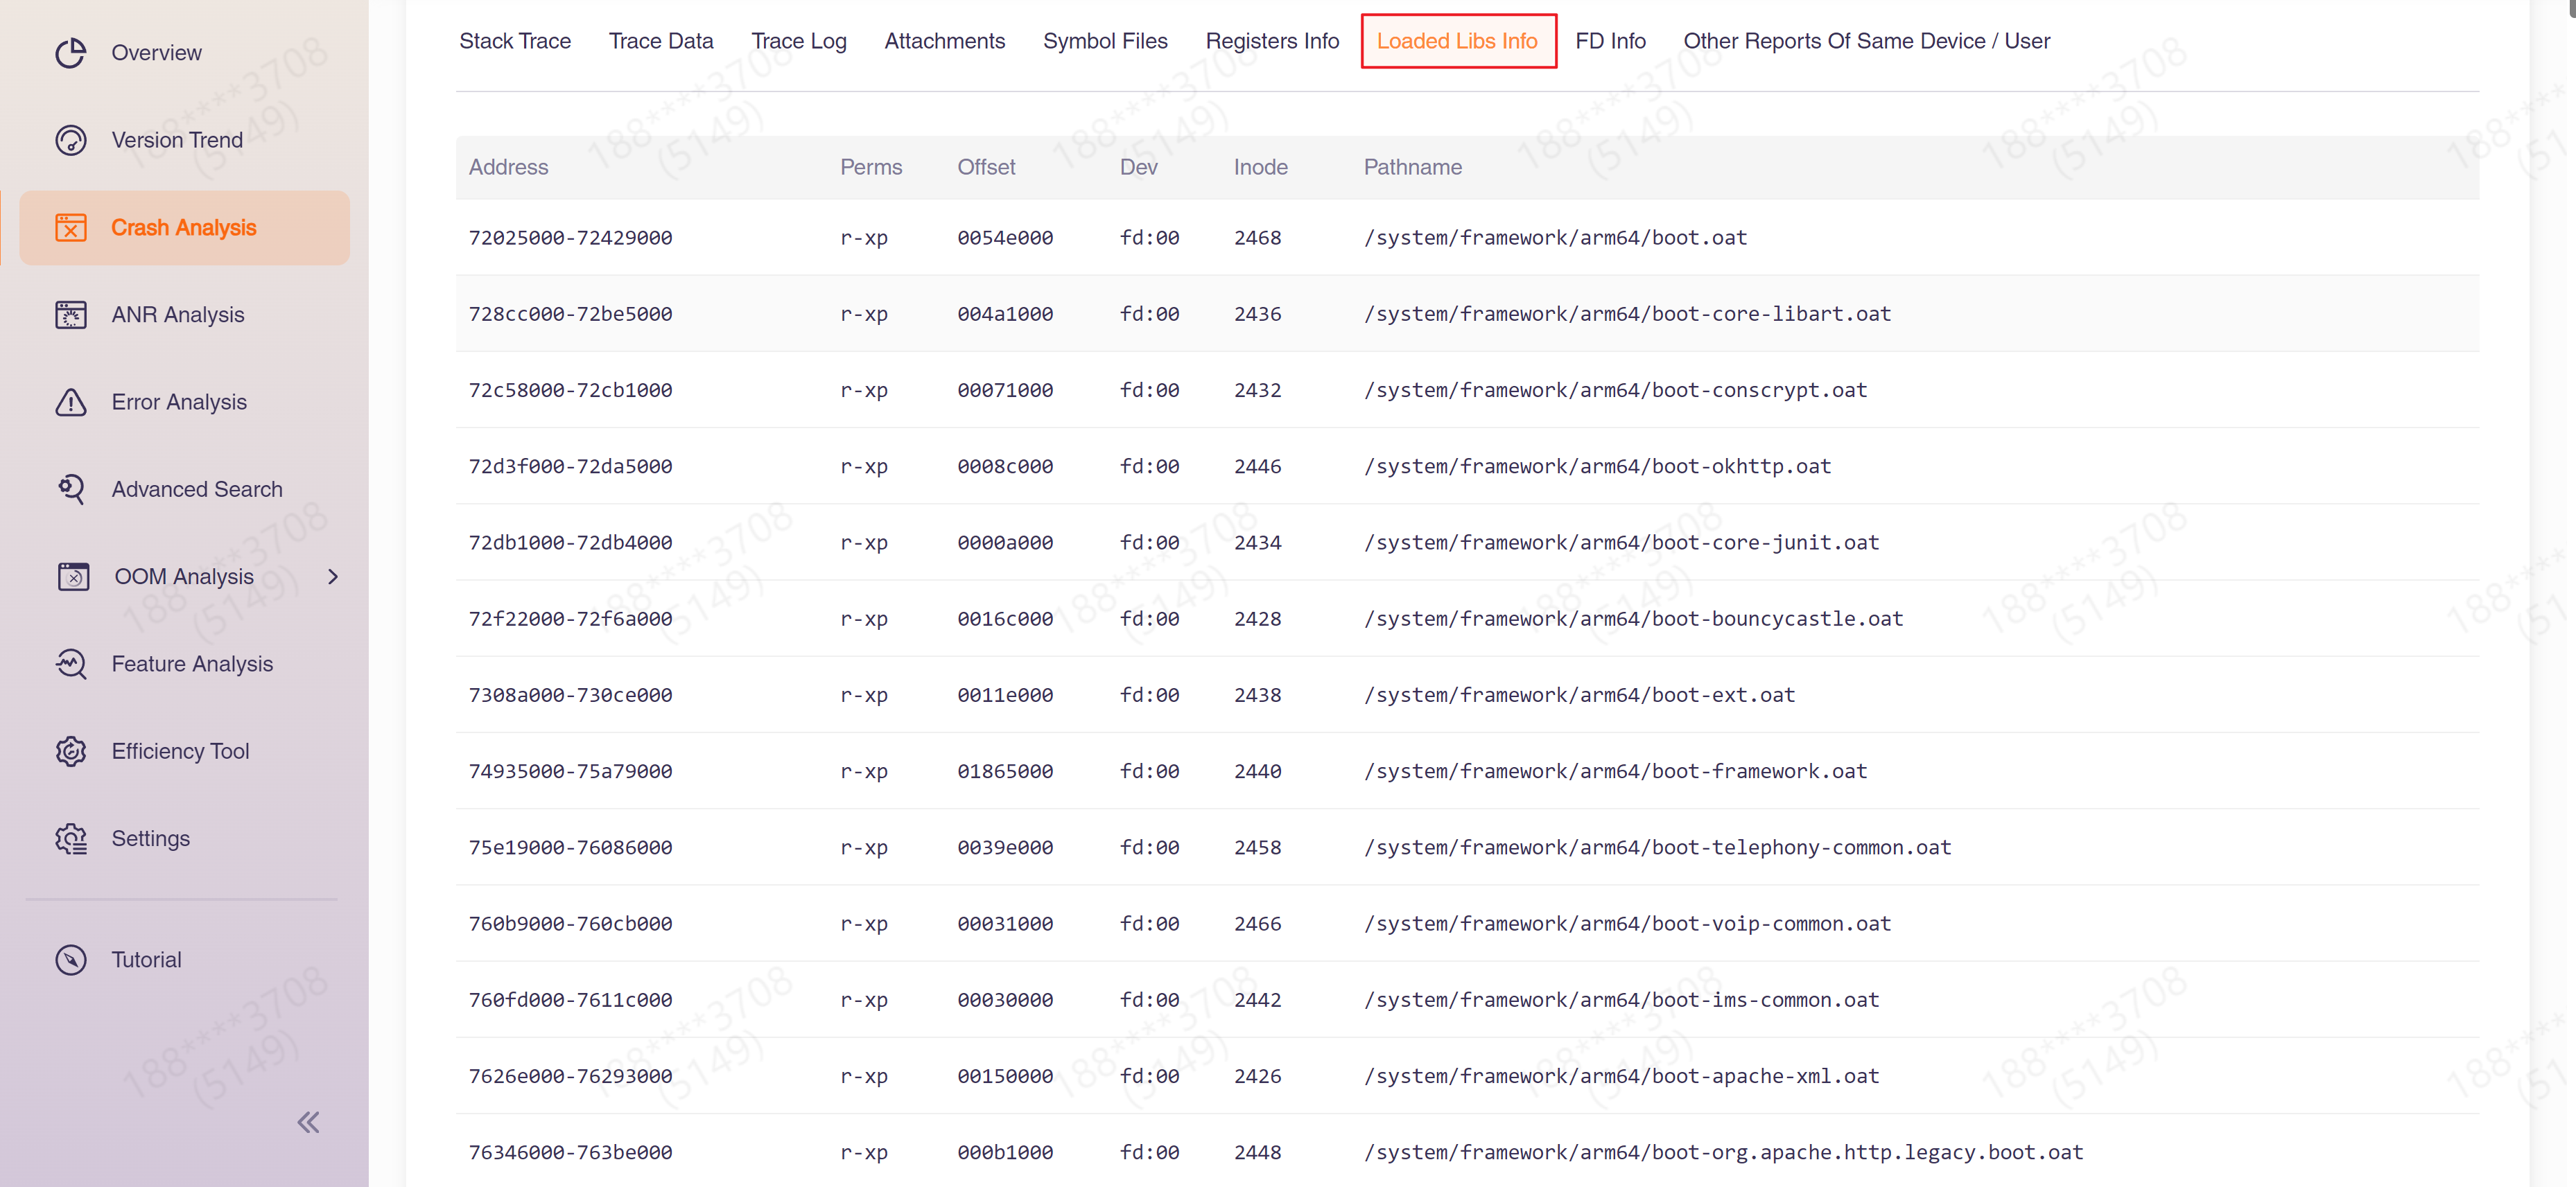
3.4 Loaded Libs Info
"Loaded Libs Info" displays the information of each loaded segment when the crash occurred.
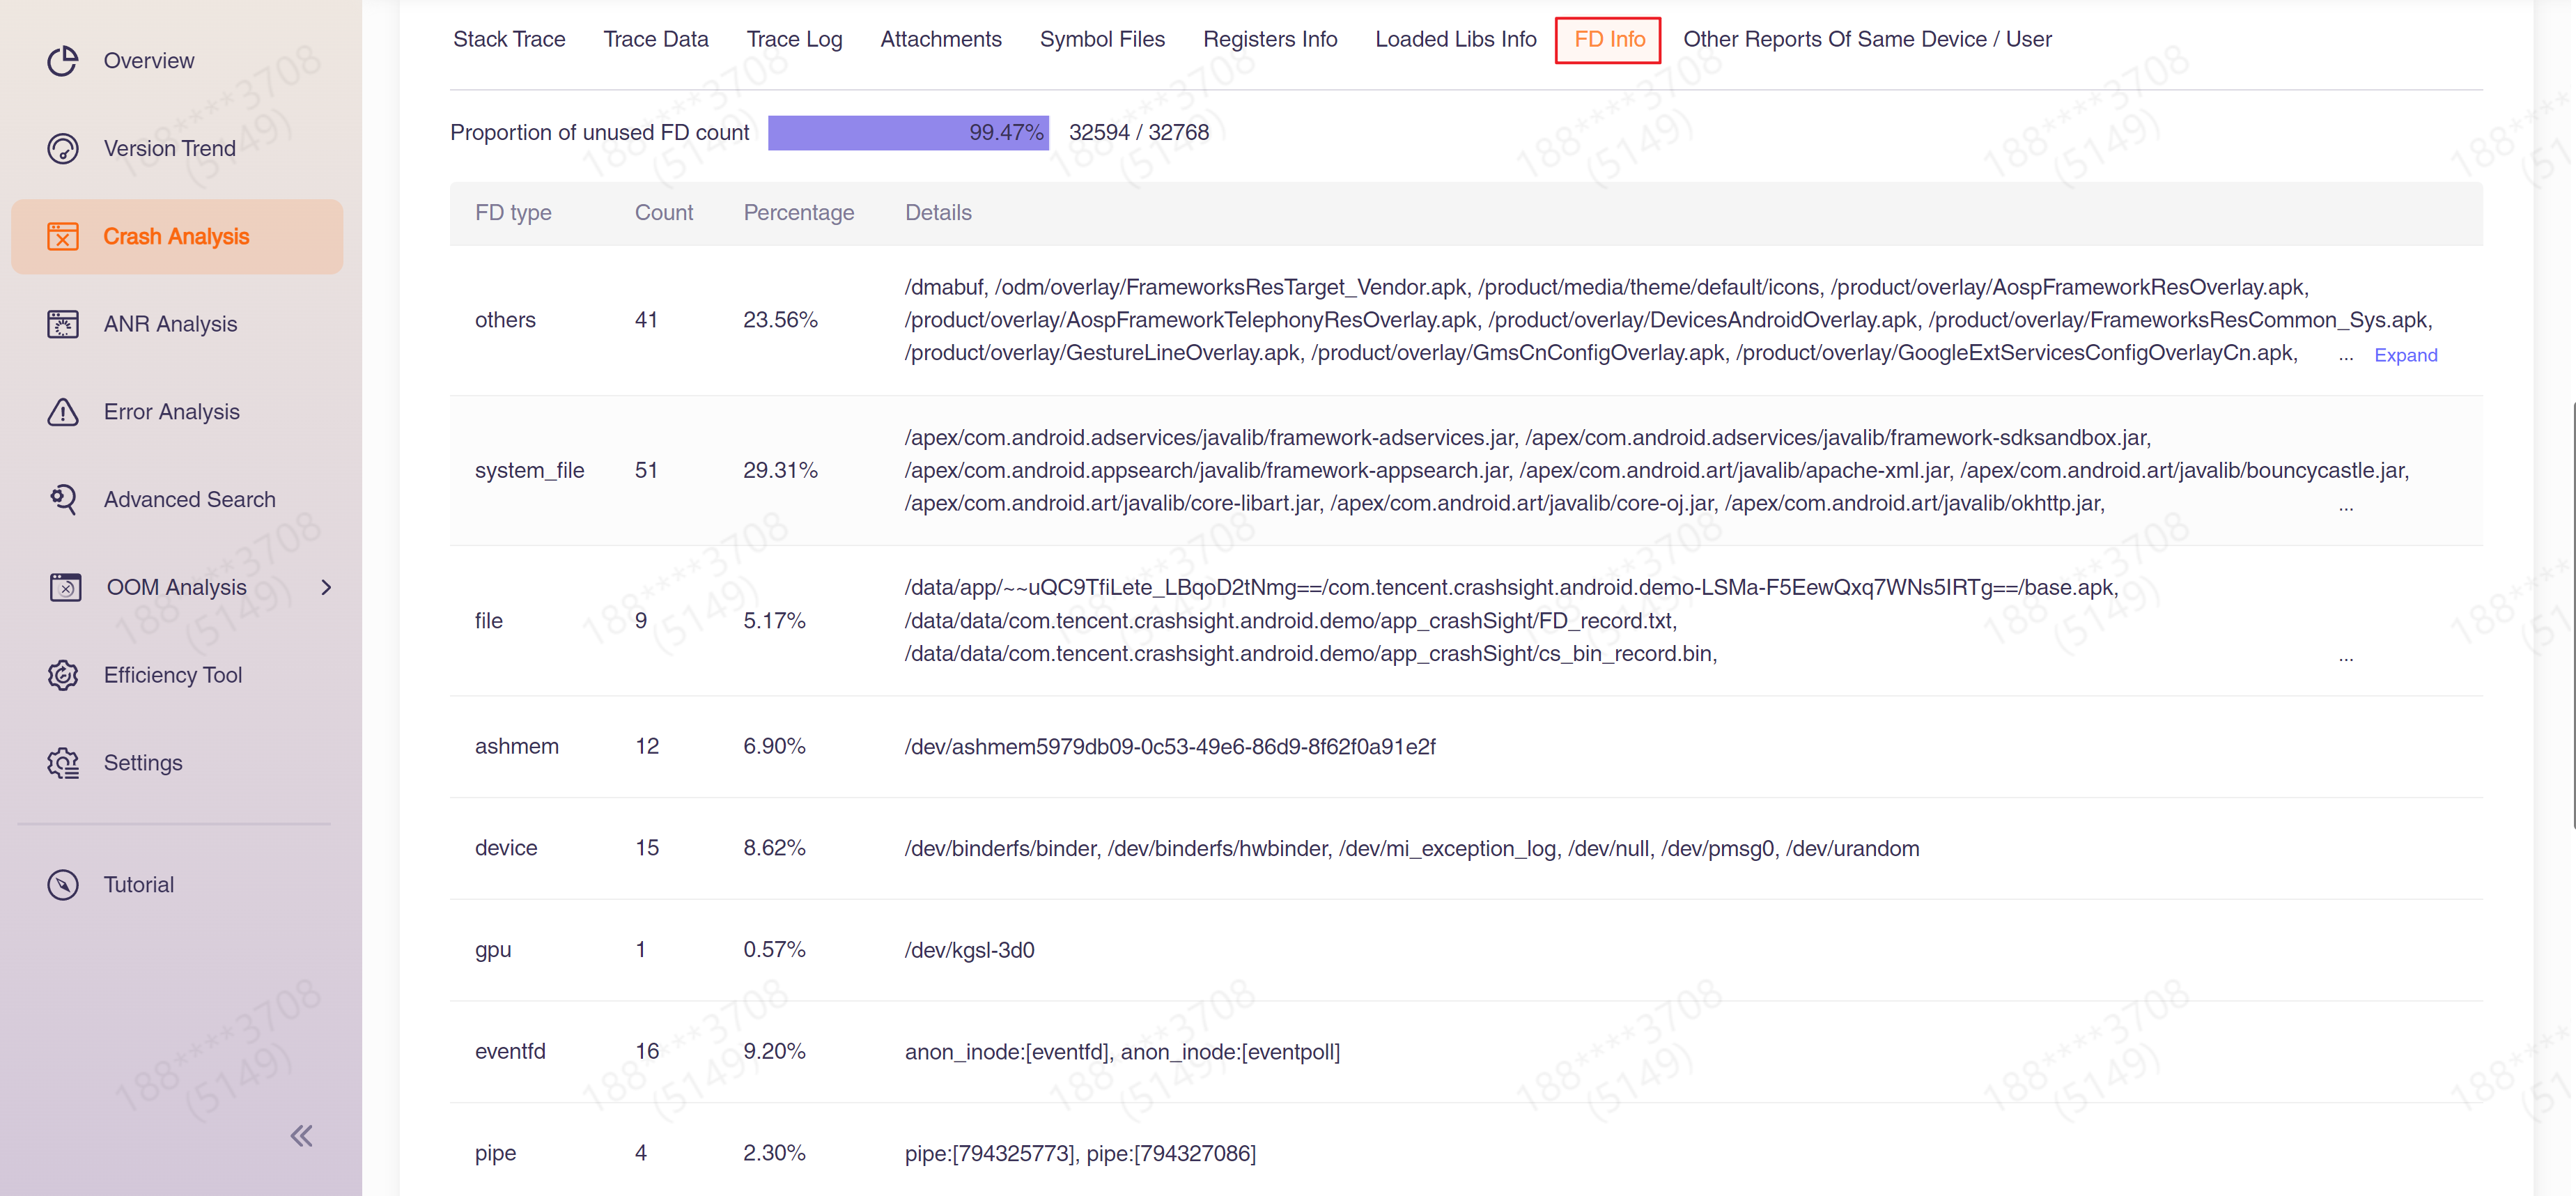
3.5 FD Info
"FD Info" shows the FD information used when the crash occurred. FDs have been classified, and you can view the proportion of each type of FD. This function is only available on Android and requires CrashSight SDK 4.2.17 or above. Please consult the CrashSight development team before using it.
ANR Analysis
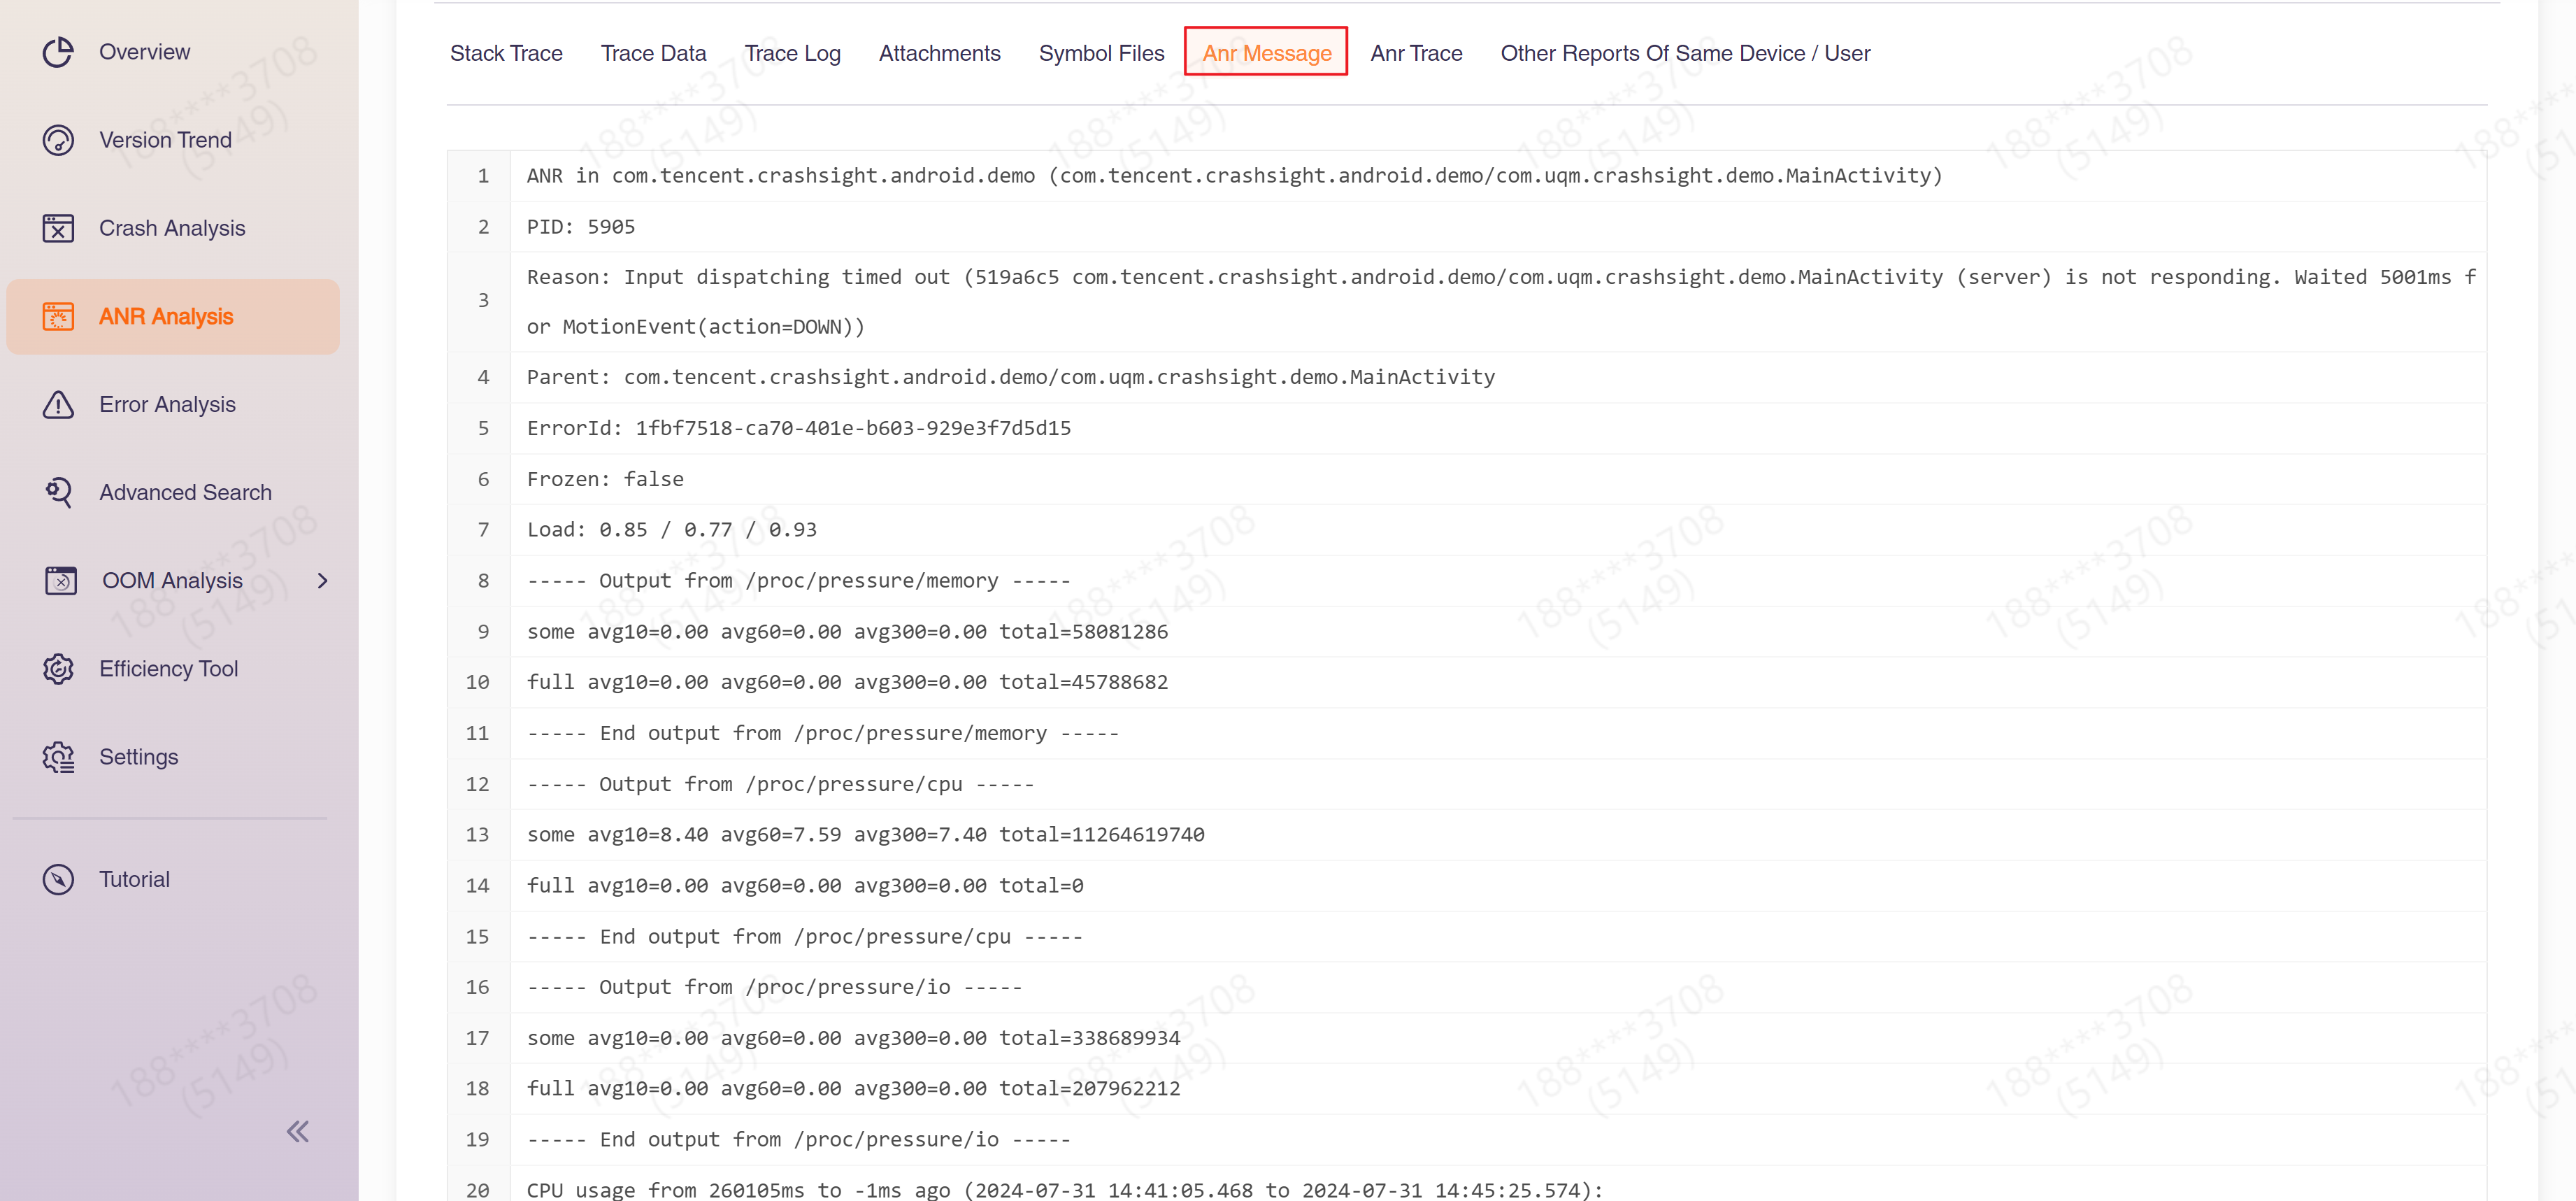
4.1 ANR Message
The ANR Message collected by CrashSight is shown here.
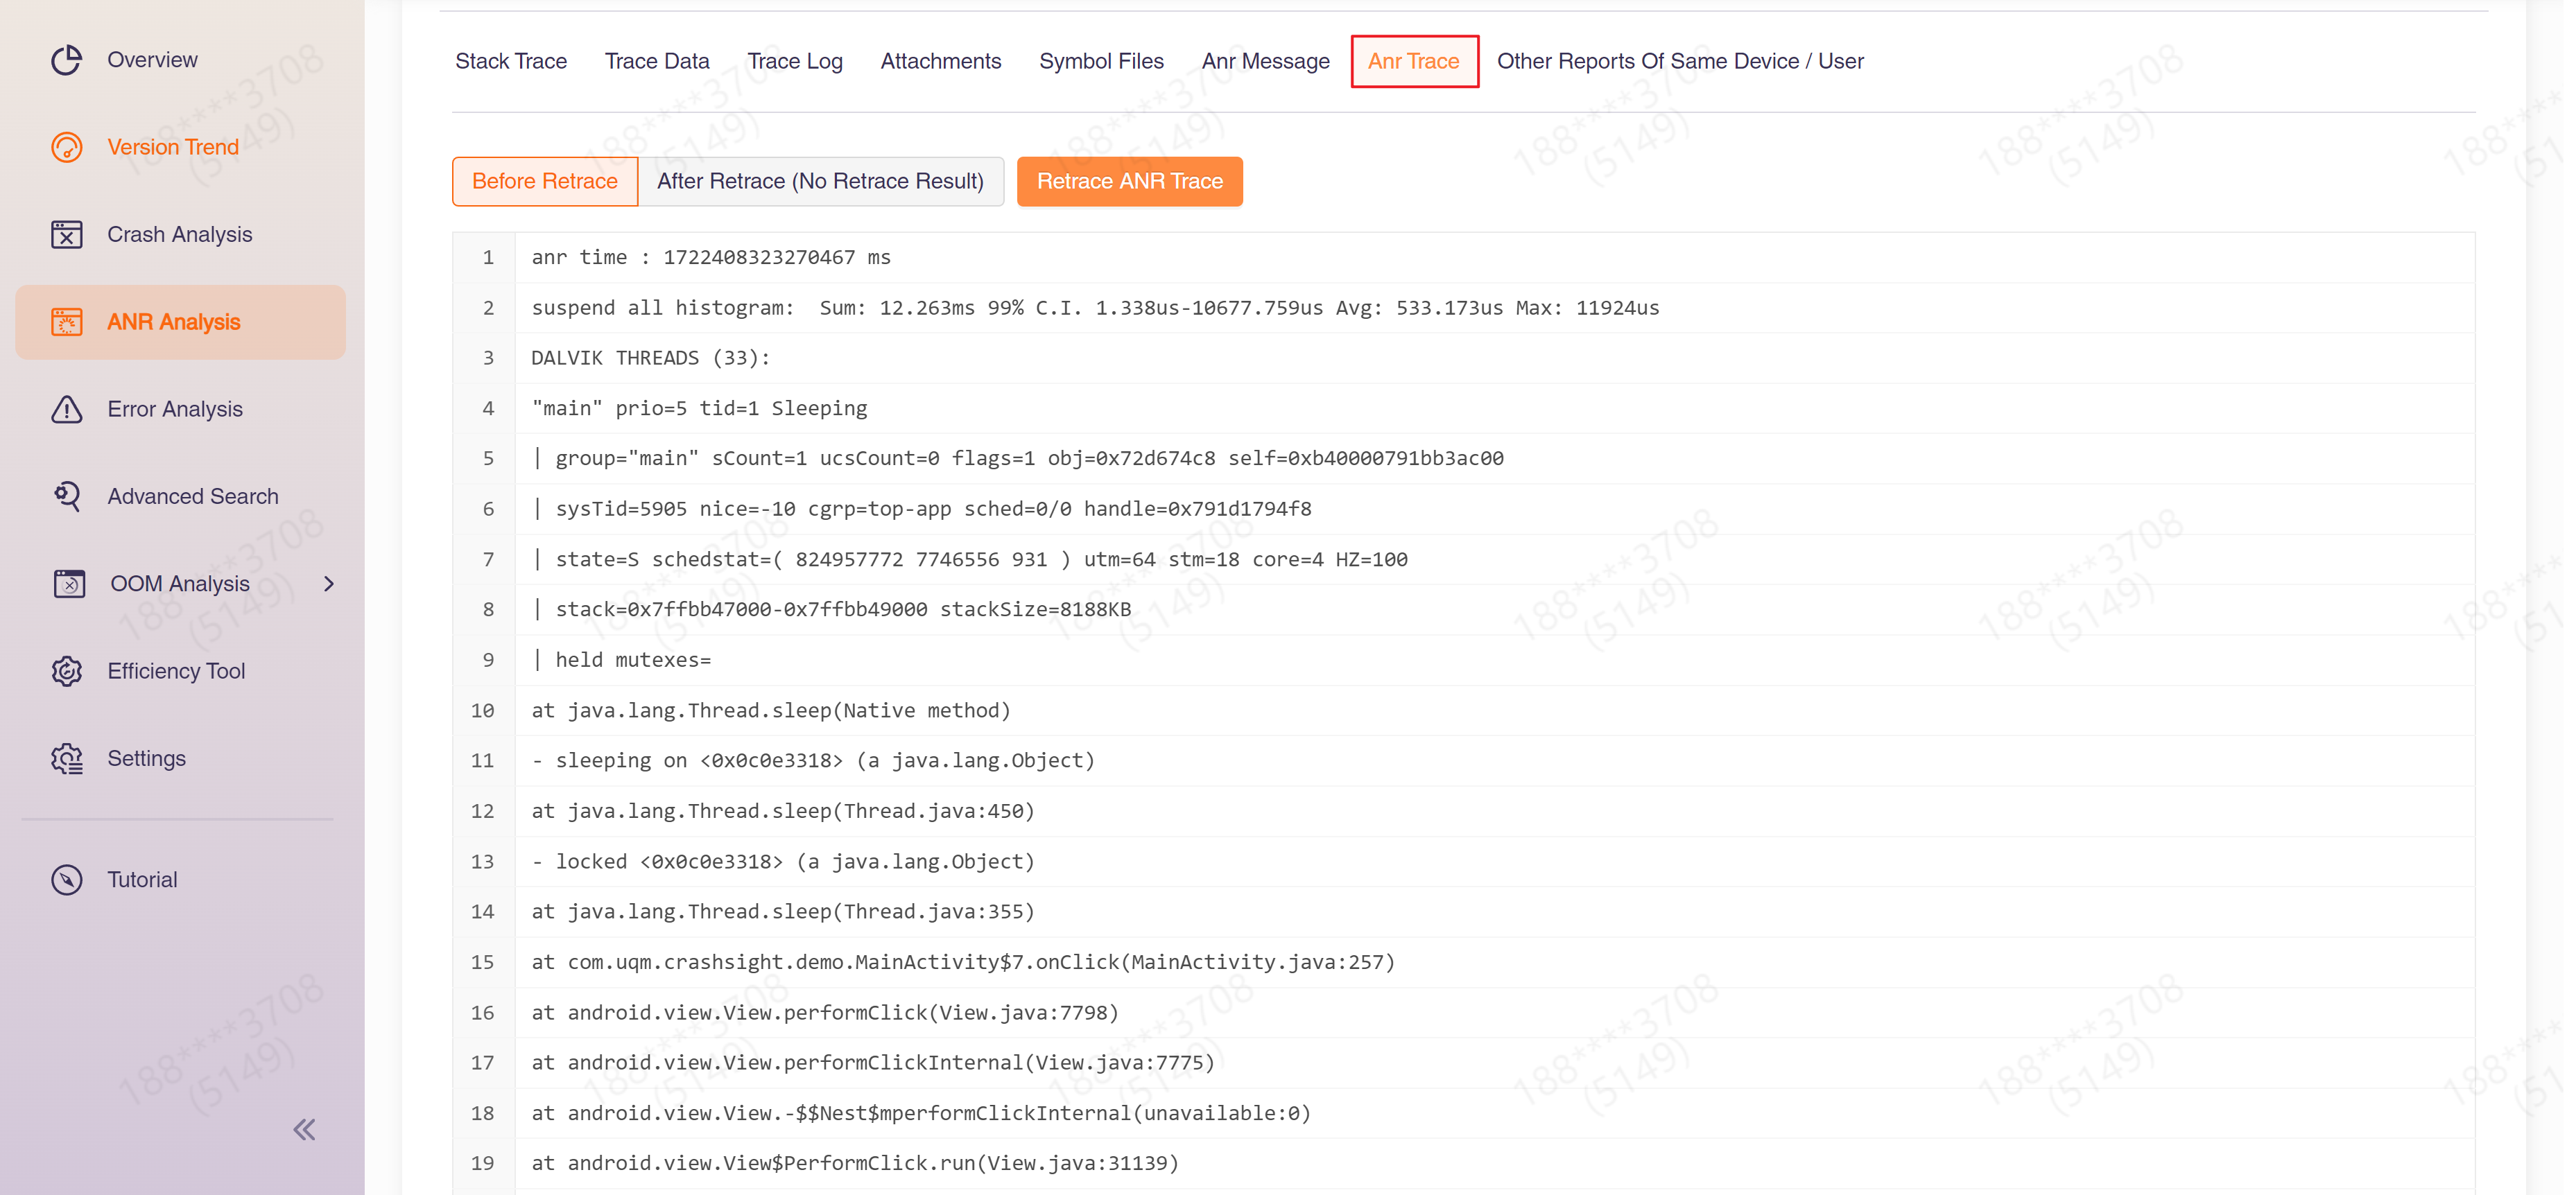
4.2 ANR Trace
Here is the stack information of the dump when ANR occurs.