Features and Dashboard Filters
CrashSight Features allows users to customize feature tags for exception reports. You can feature reports based on stack content and specific fields contained in exception messages. Or you can quickly mark reports of a feature type through any other reporting field, such as "external virtual machine", "lower version of Android", or other user-defined feature tags.
After creating and enabling the feature rule, you can directly view the trend statistics of the hit feature tags on the page and analyze the impact range. You can also configure specific feature filtering strategies for statistical data based on feature tags.
The specific operations are described below.
In Features section, you can configure feature rules for reports using report fields. You can also quickly analyze reports with the same feature rules (referred to as "feature reports"), including Feature Stats (Feature Stats, Detail Stats) and Feature Rules.
1 Feature Stats
The trend graph displays the occurrence of feature reports in chronological order.
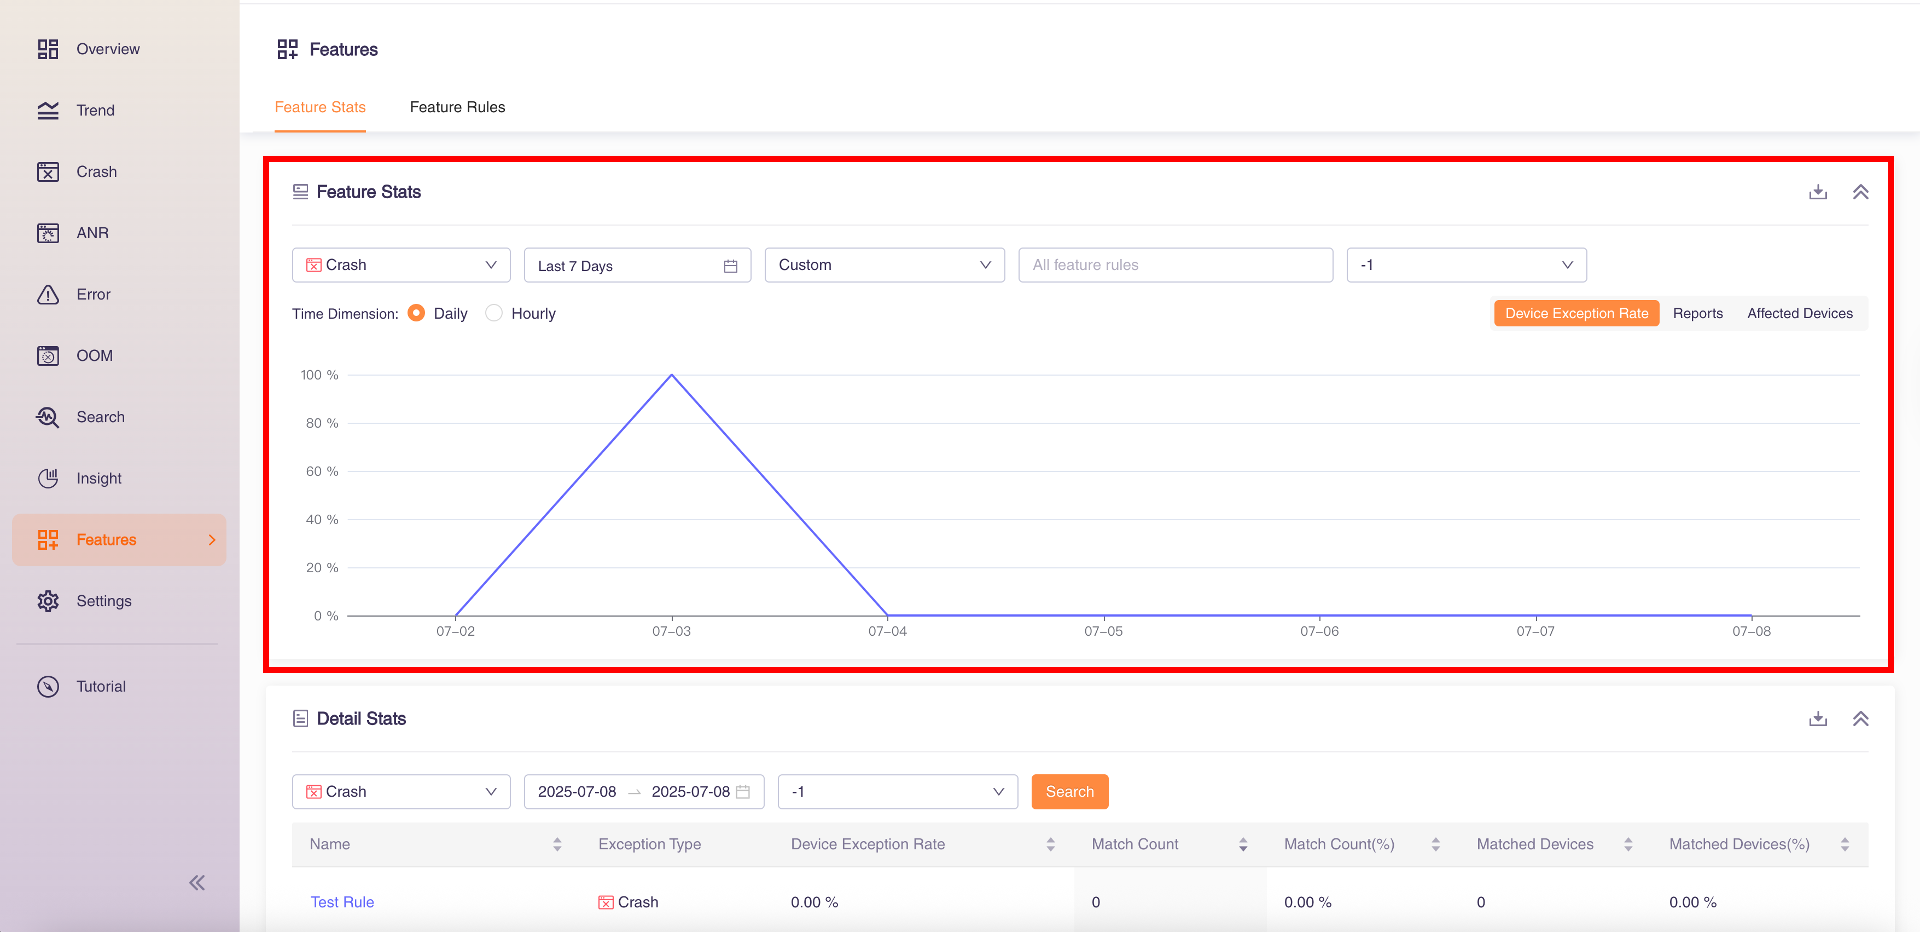
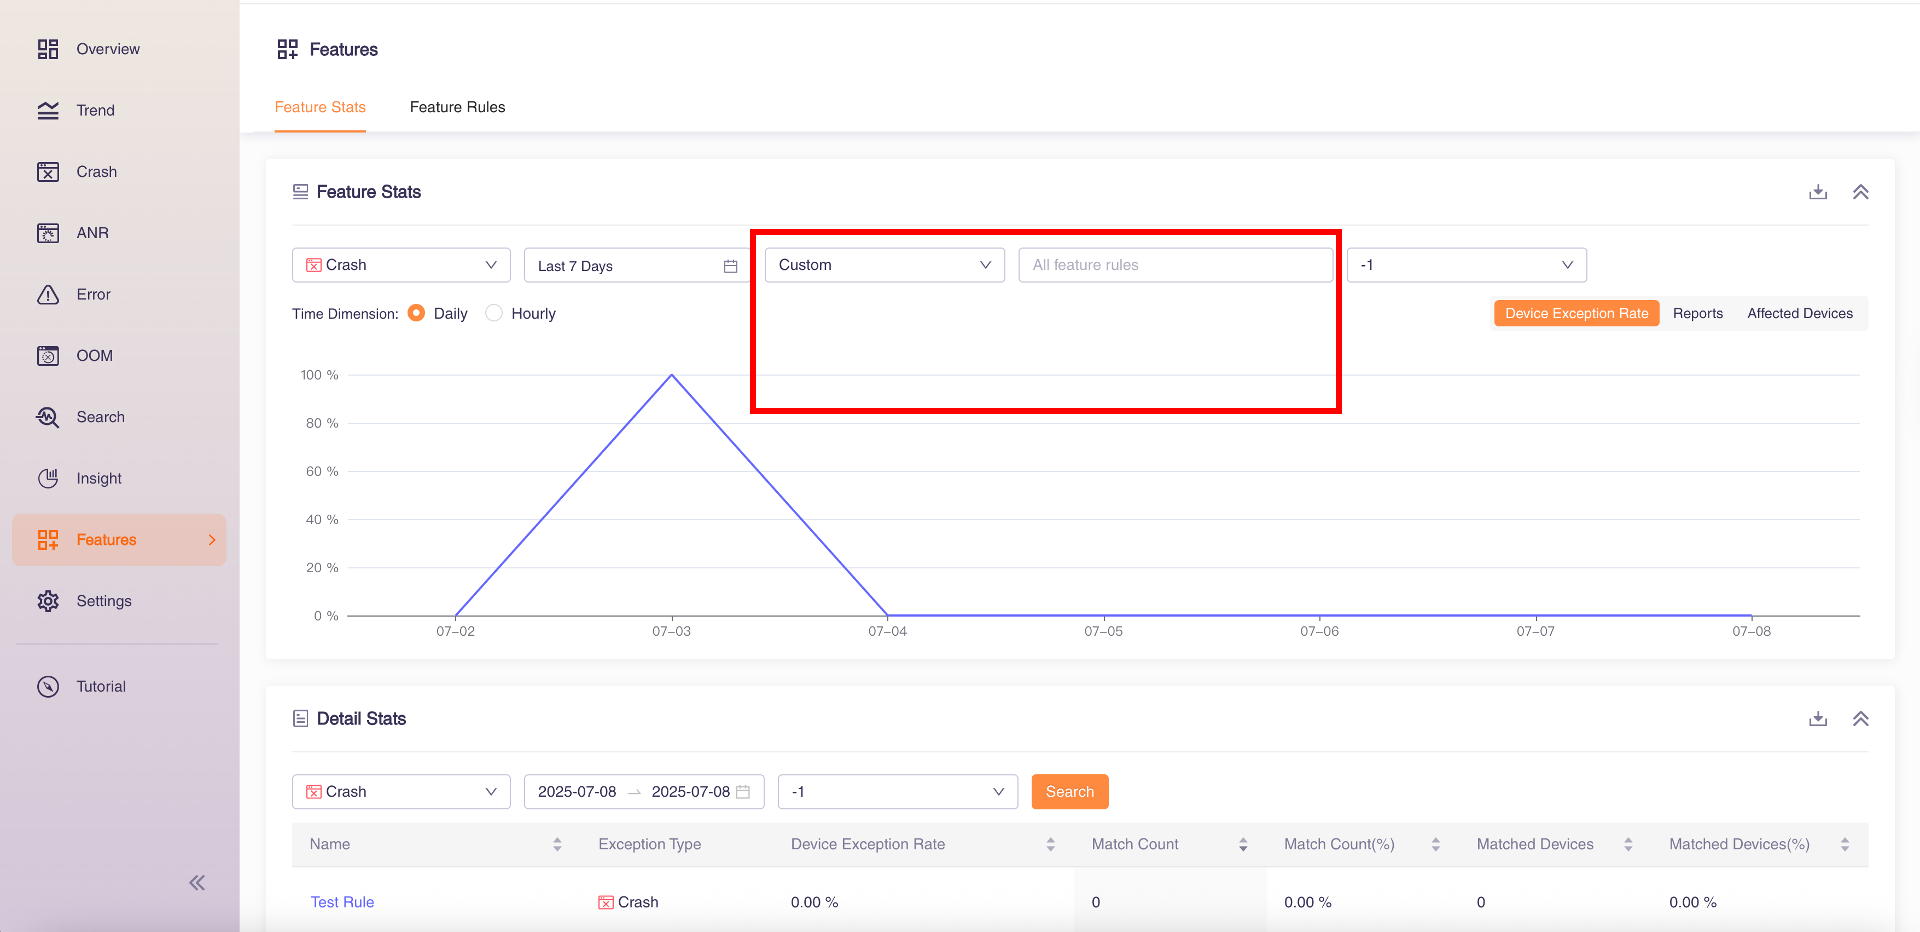
You can select the exception category (default Crash), time (default today), version (default All App Versions), and feature (default Top 5) to filter the trend graph data. Features include Top5, Top10, and Custom where you can select all created feature rules.
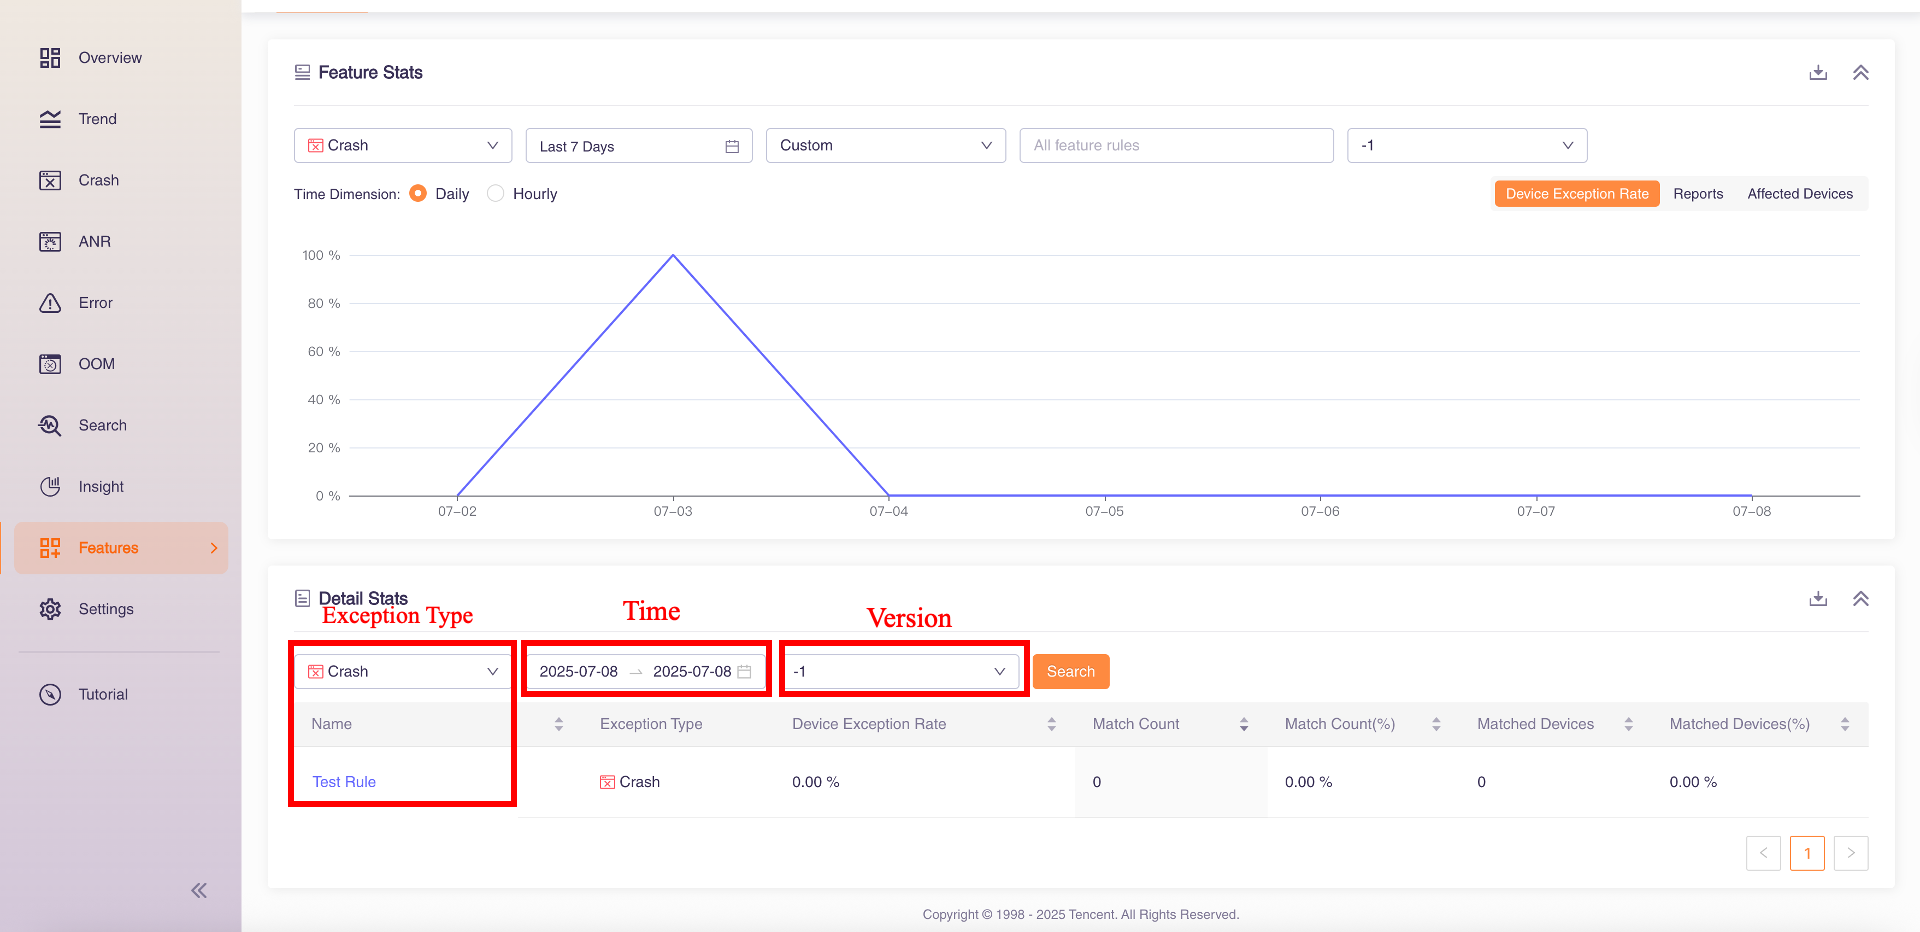
The Detail Stats section shows the feature report statistics and details, including Feature Name, Exception Type, Device Exception Rate, Match Count, Match Count (%), Matched Devices, Matched Devices(%).
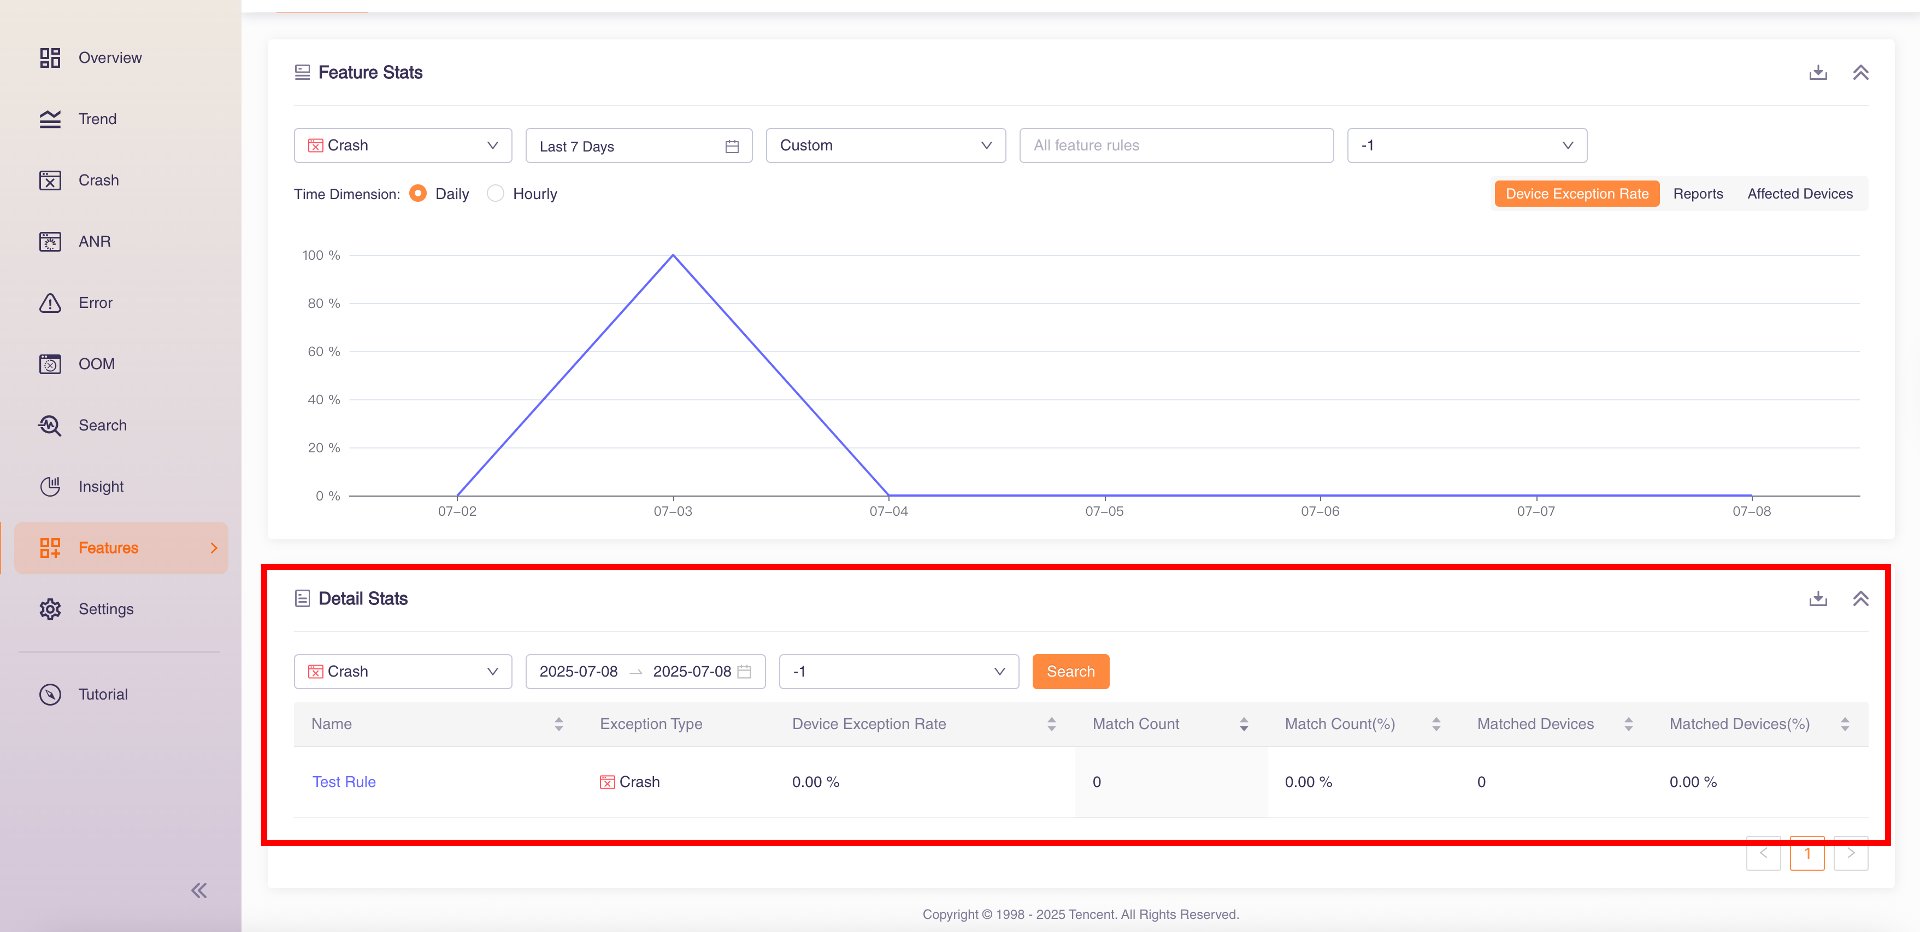
You can select the exception category (default Crash), time (default Today), and version (default All App Versions) to filter the statistics and details data.
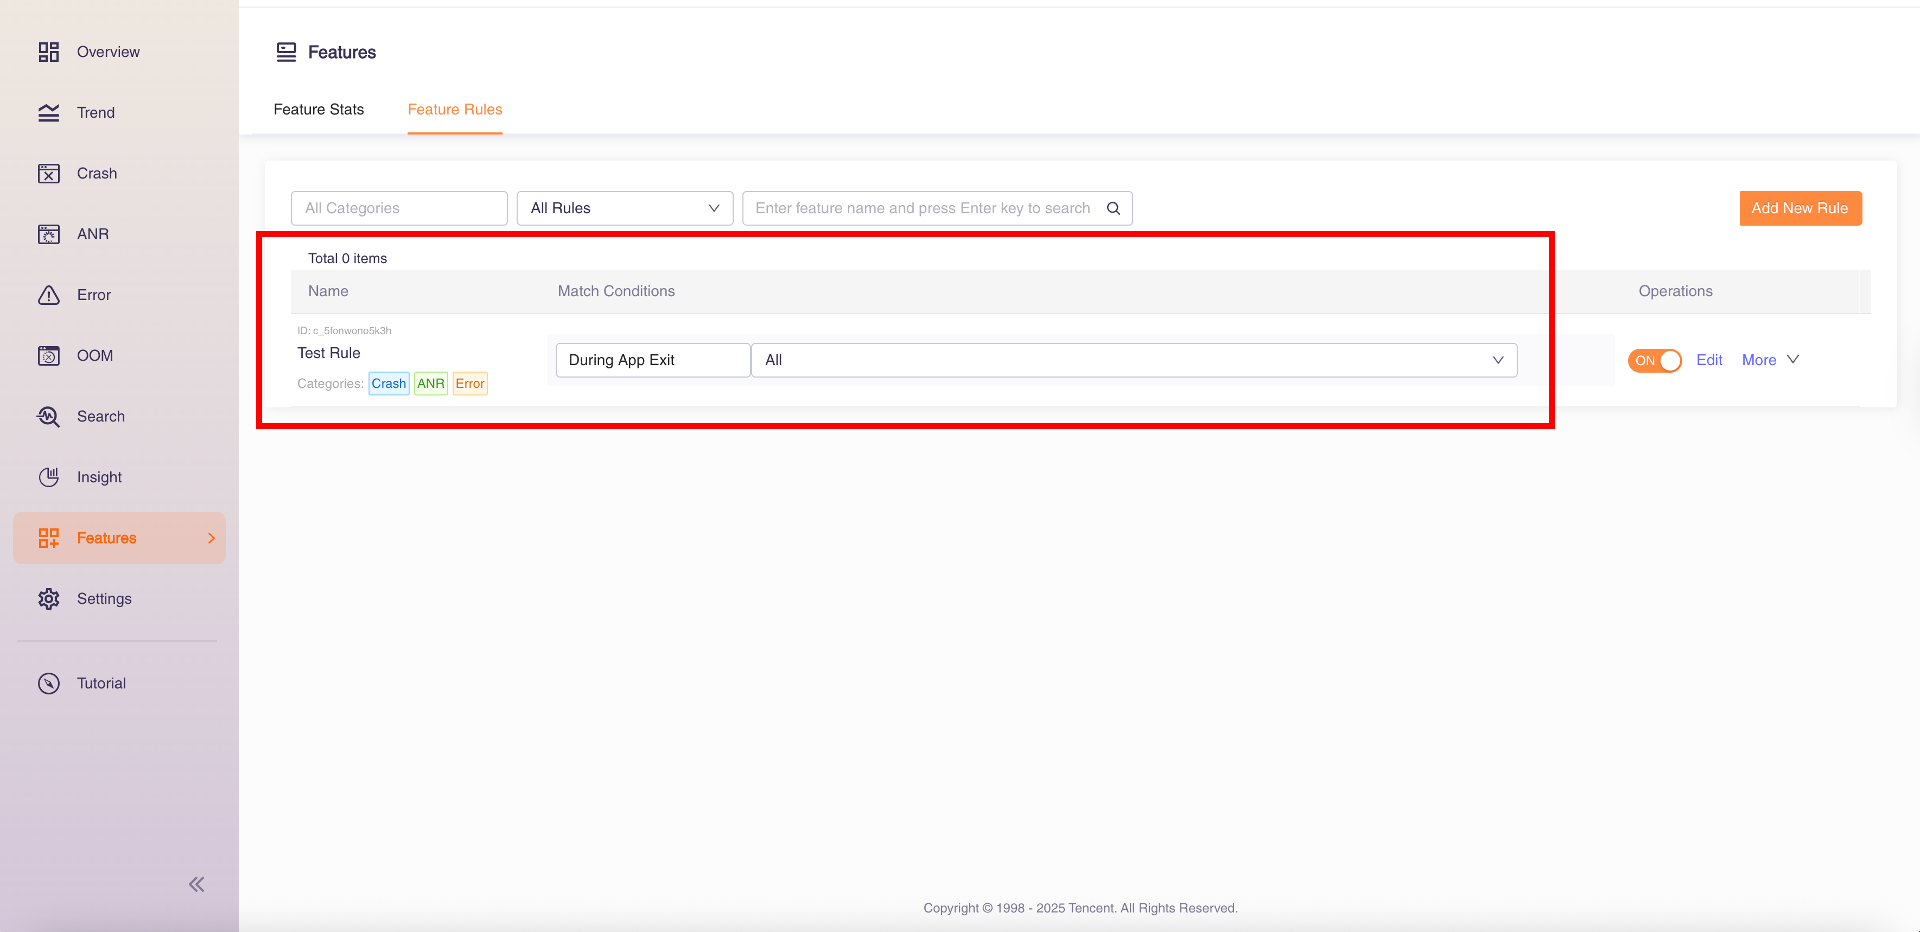
2 Feature Rules
The Feature Rules section, you can view and manage all your created feature rules, including feature name, exception category, ID, and match conditions.
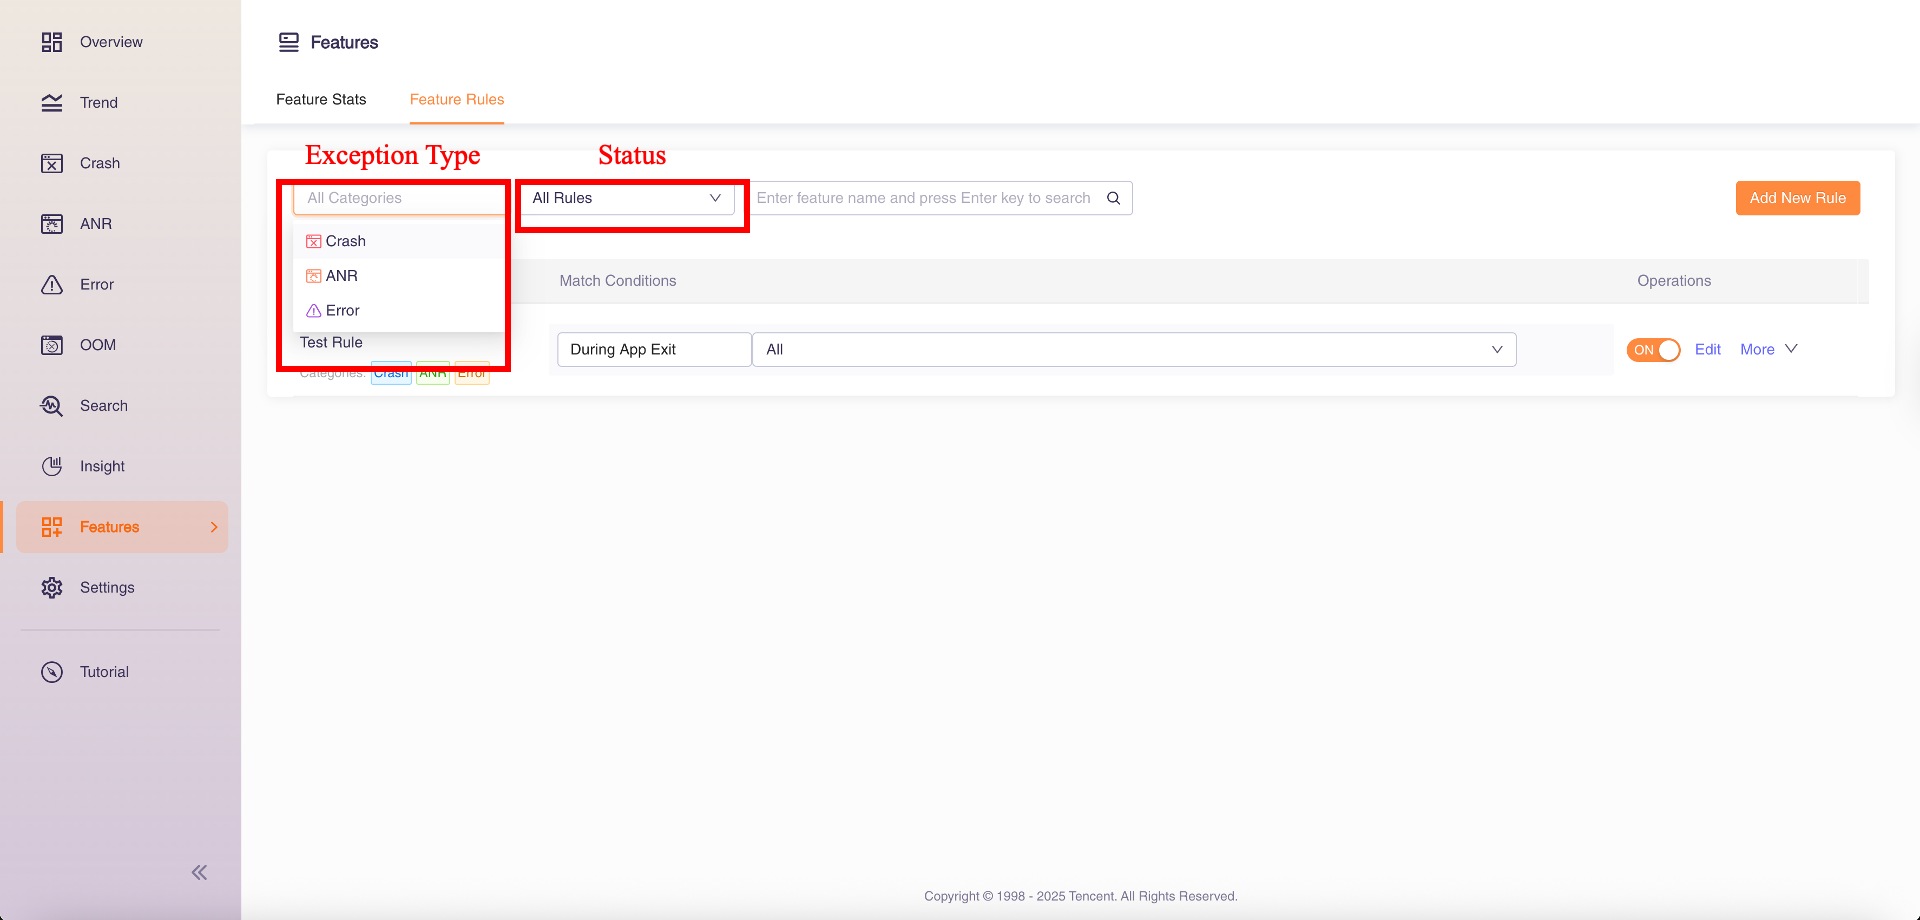
You can select the exception category (default All Categories), status (default All Rules), feature name to filter the feature rules.
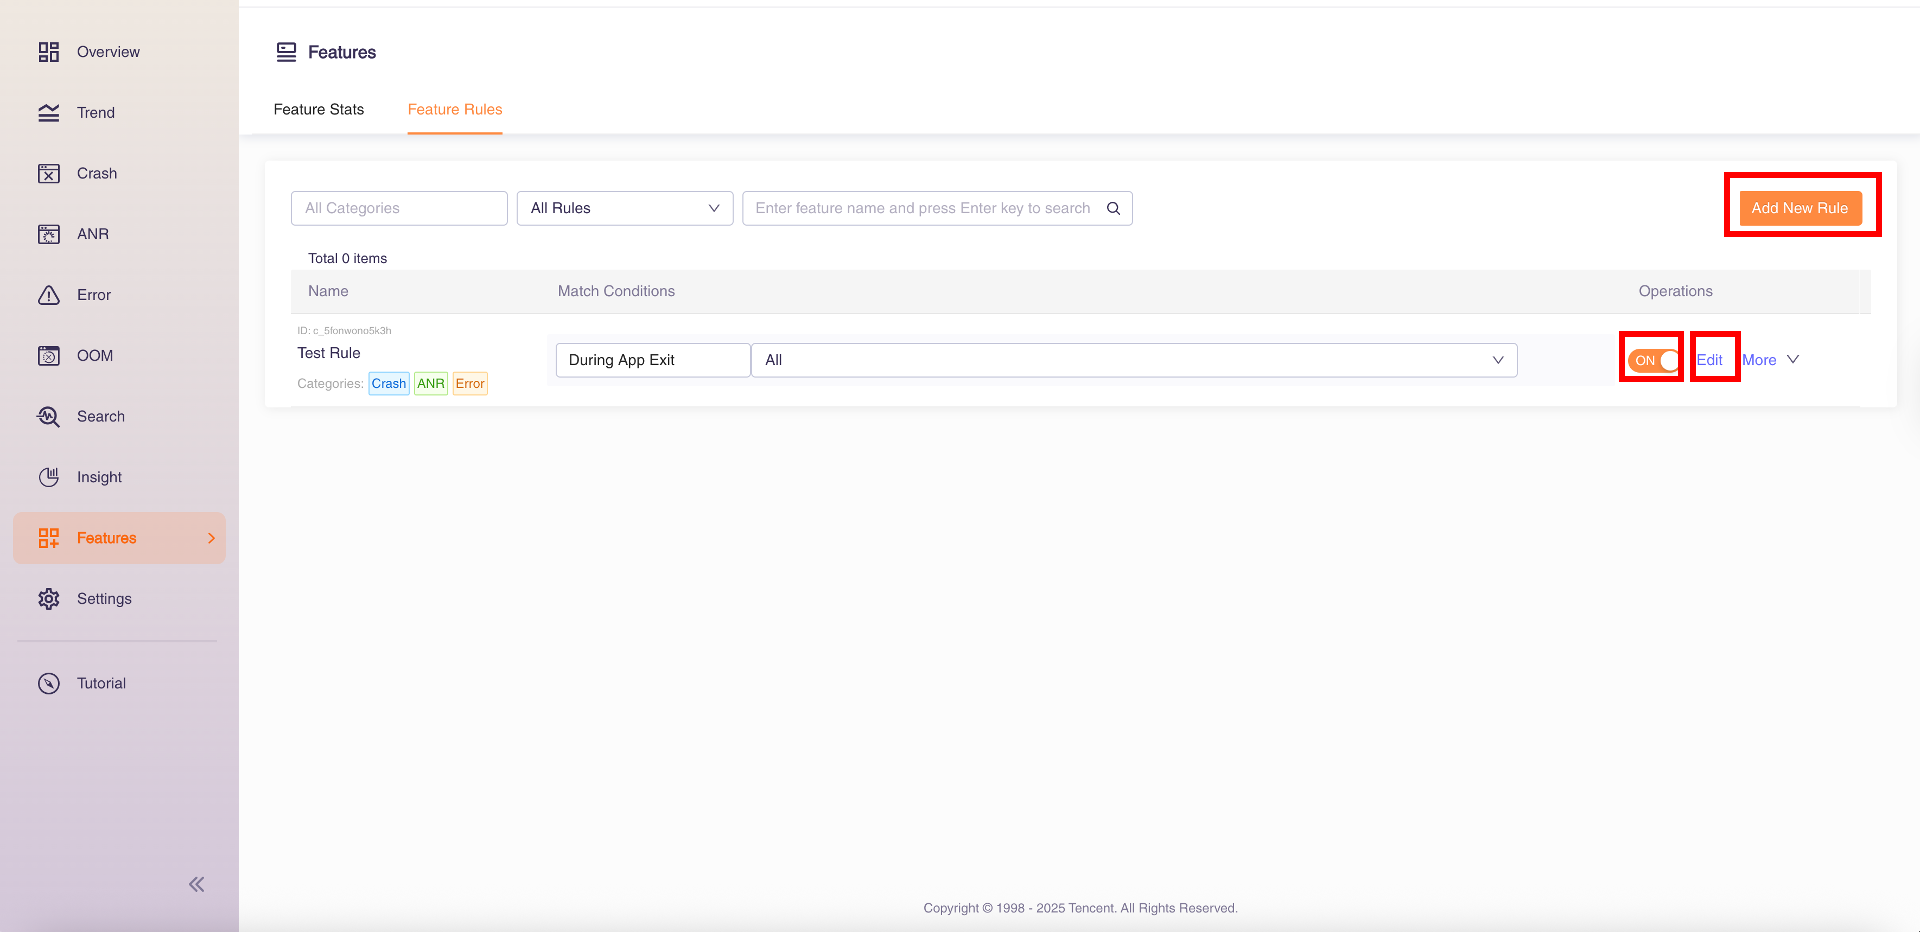
Click "Add New Rule" to create a new one or click "Edit" to modify existing configurations. Use the "Enable" button to control feature rule activation.
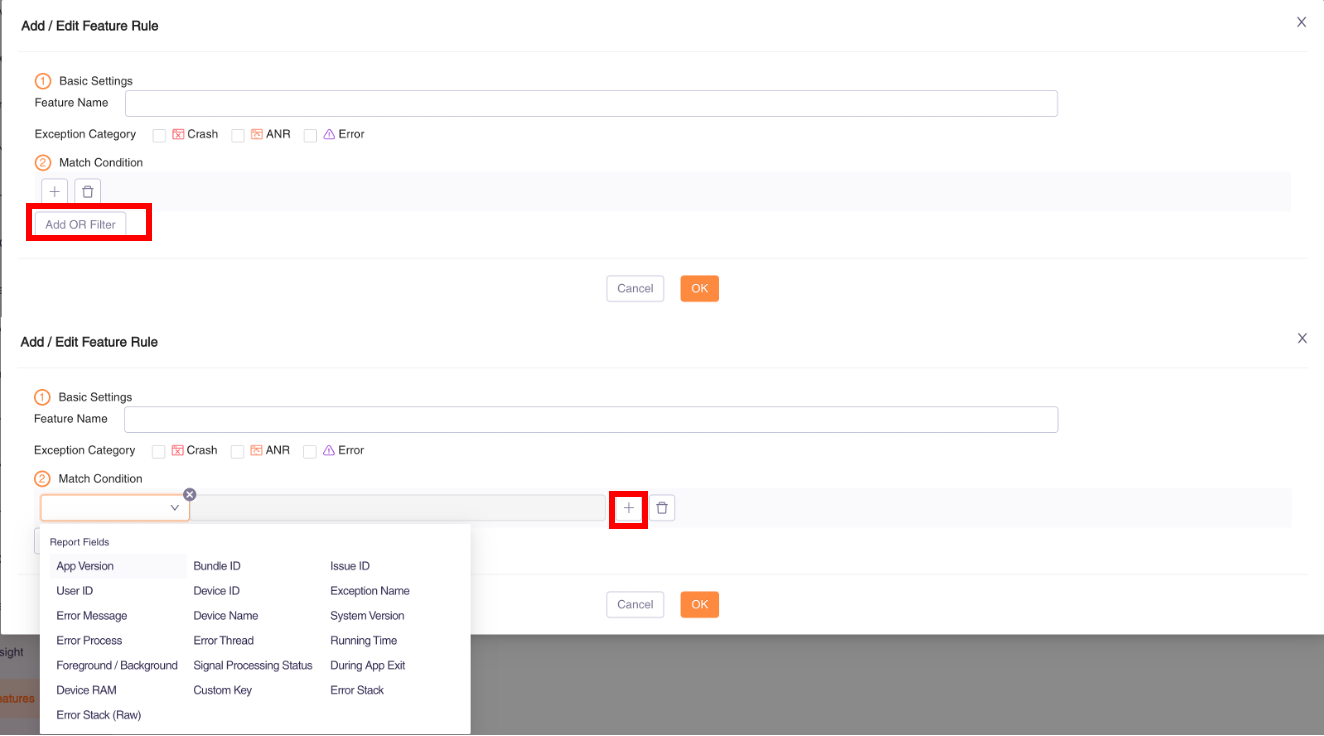
Configuration interface:
| Configuration Items | Explanation |
|---|---|
| Feature Name | Set your feature name; Use feature name search related data in "Search"; You can also configure dashboard filtering strategies by feature name under "Settings > Product Settings > Dashboard Filters" to filter overview and trend pages statistics. |
| Exception Category | Select the exception category for reporting, which serves as a filter condition during feature trend analysis. |
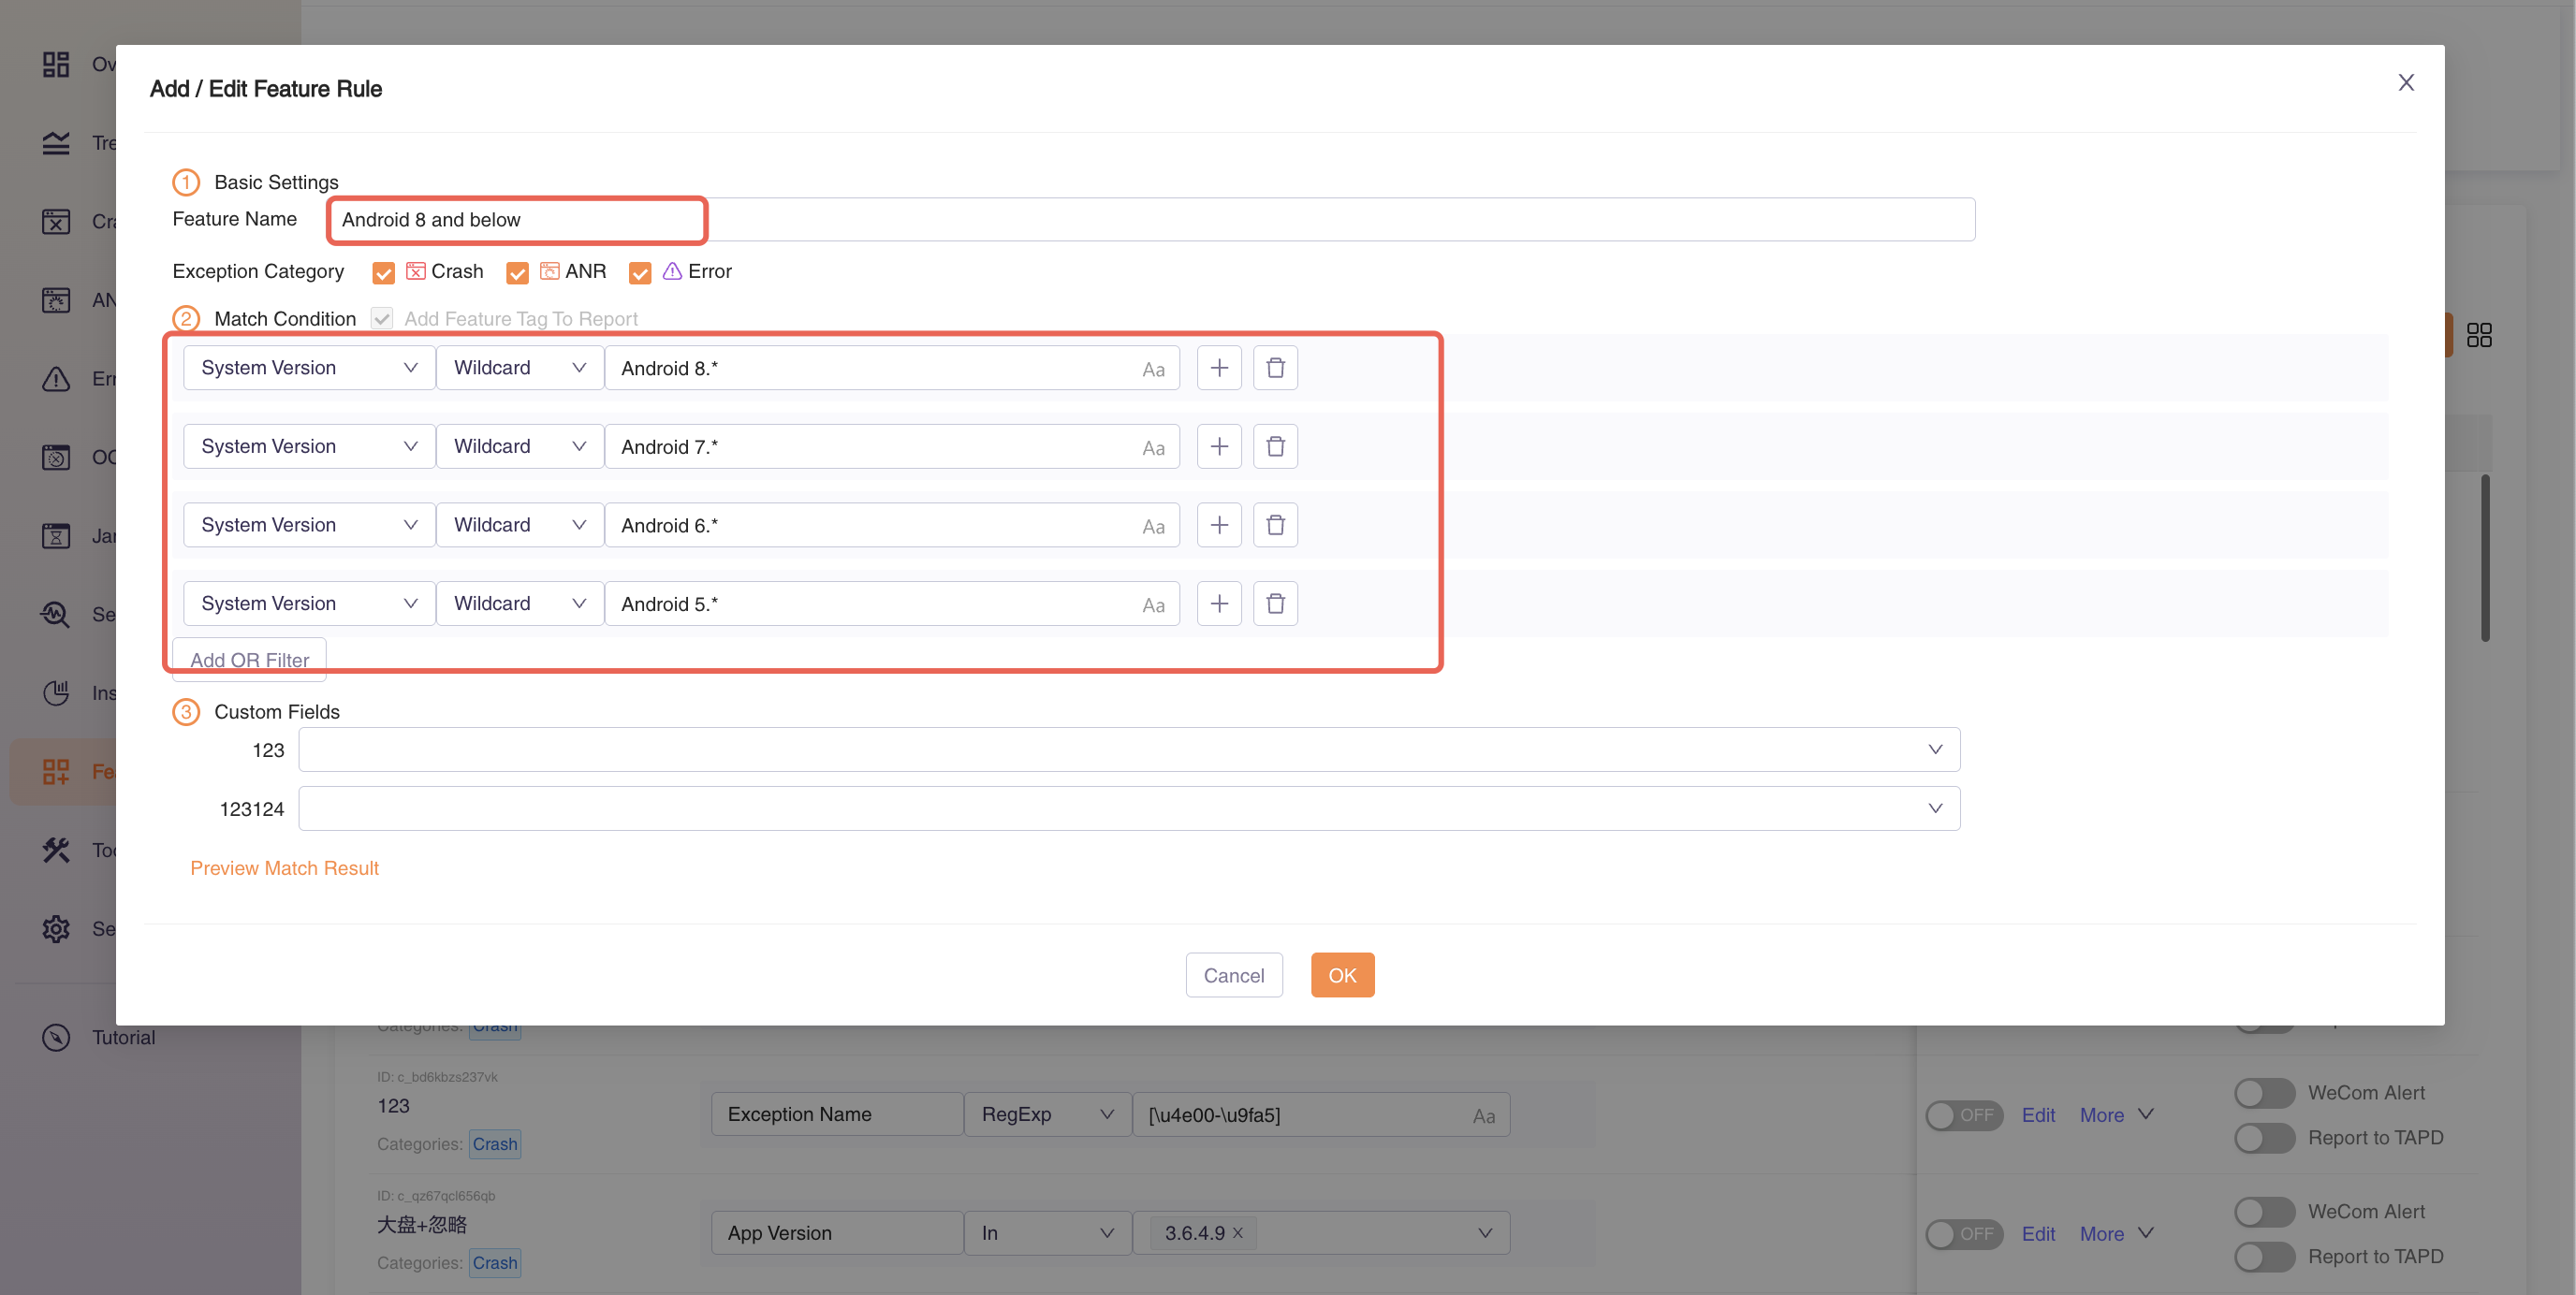
| Match Condition | Configure match conditions by report fields. When adding conditions through "+" in a filter, all conditions must be met to trigger feature statistics. To trigger statistics when any condition is met, click "Add OR Filter" and then add match conditions. |
3 Dashboard Filters
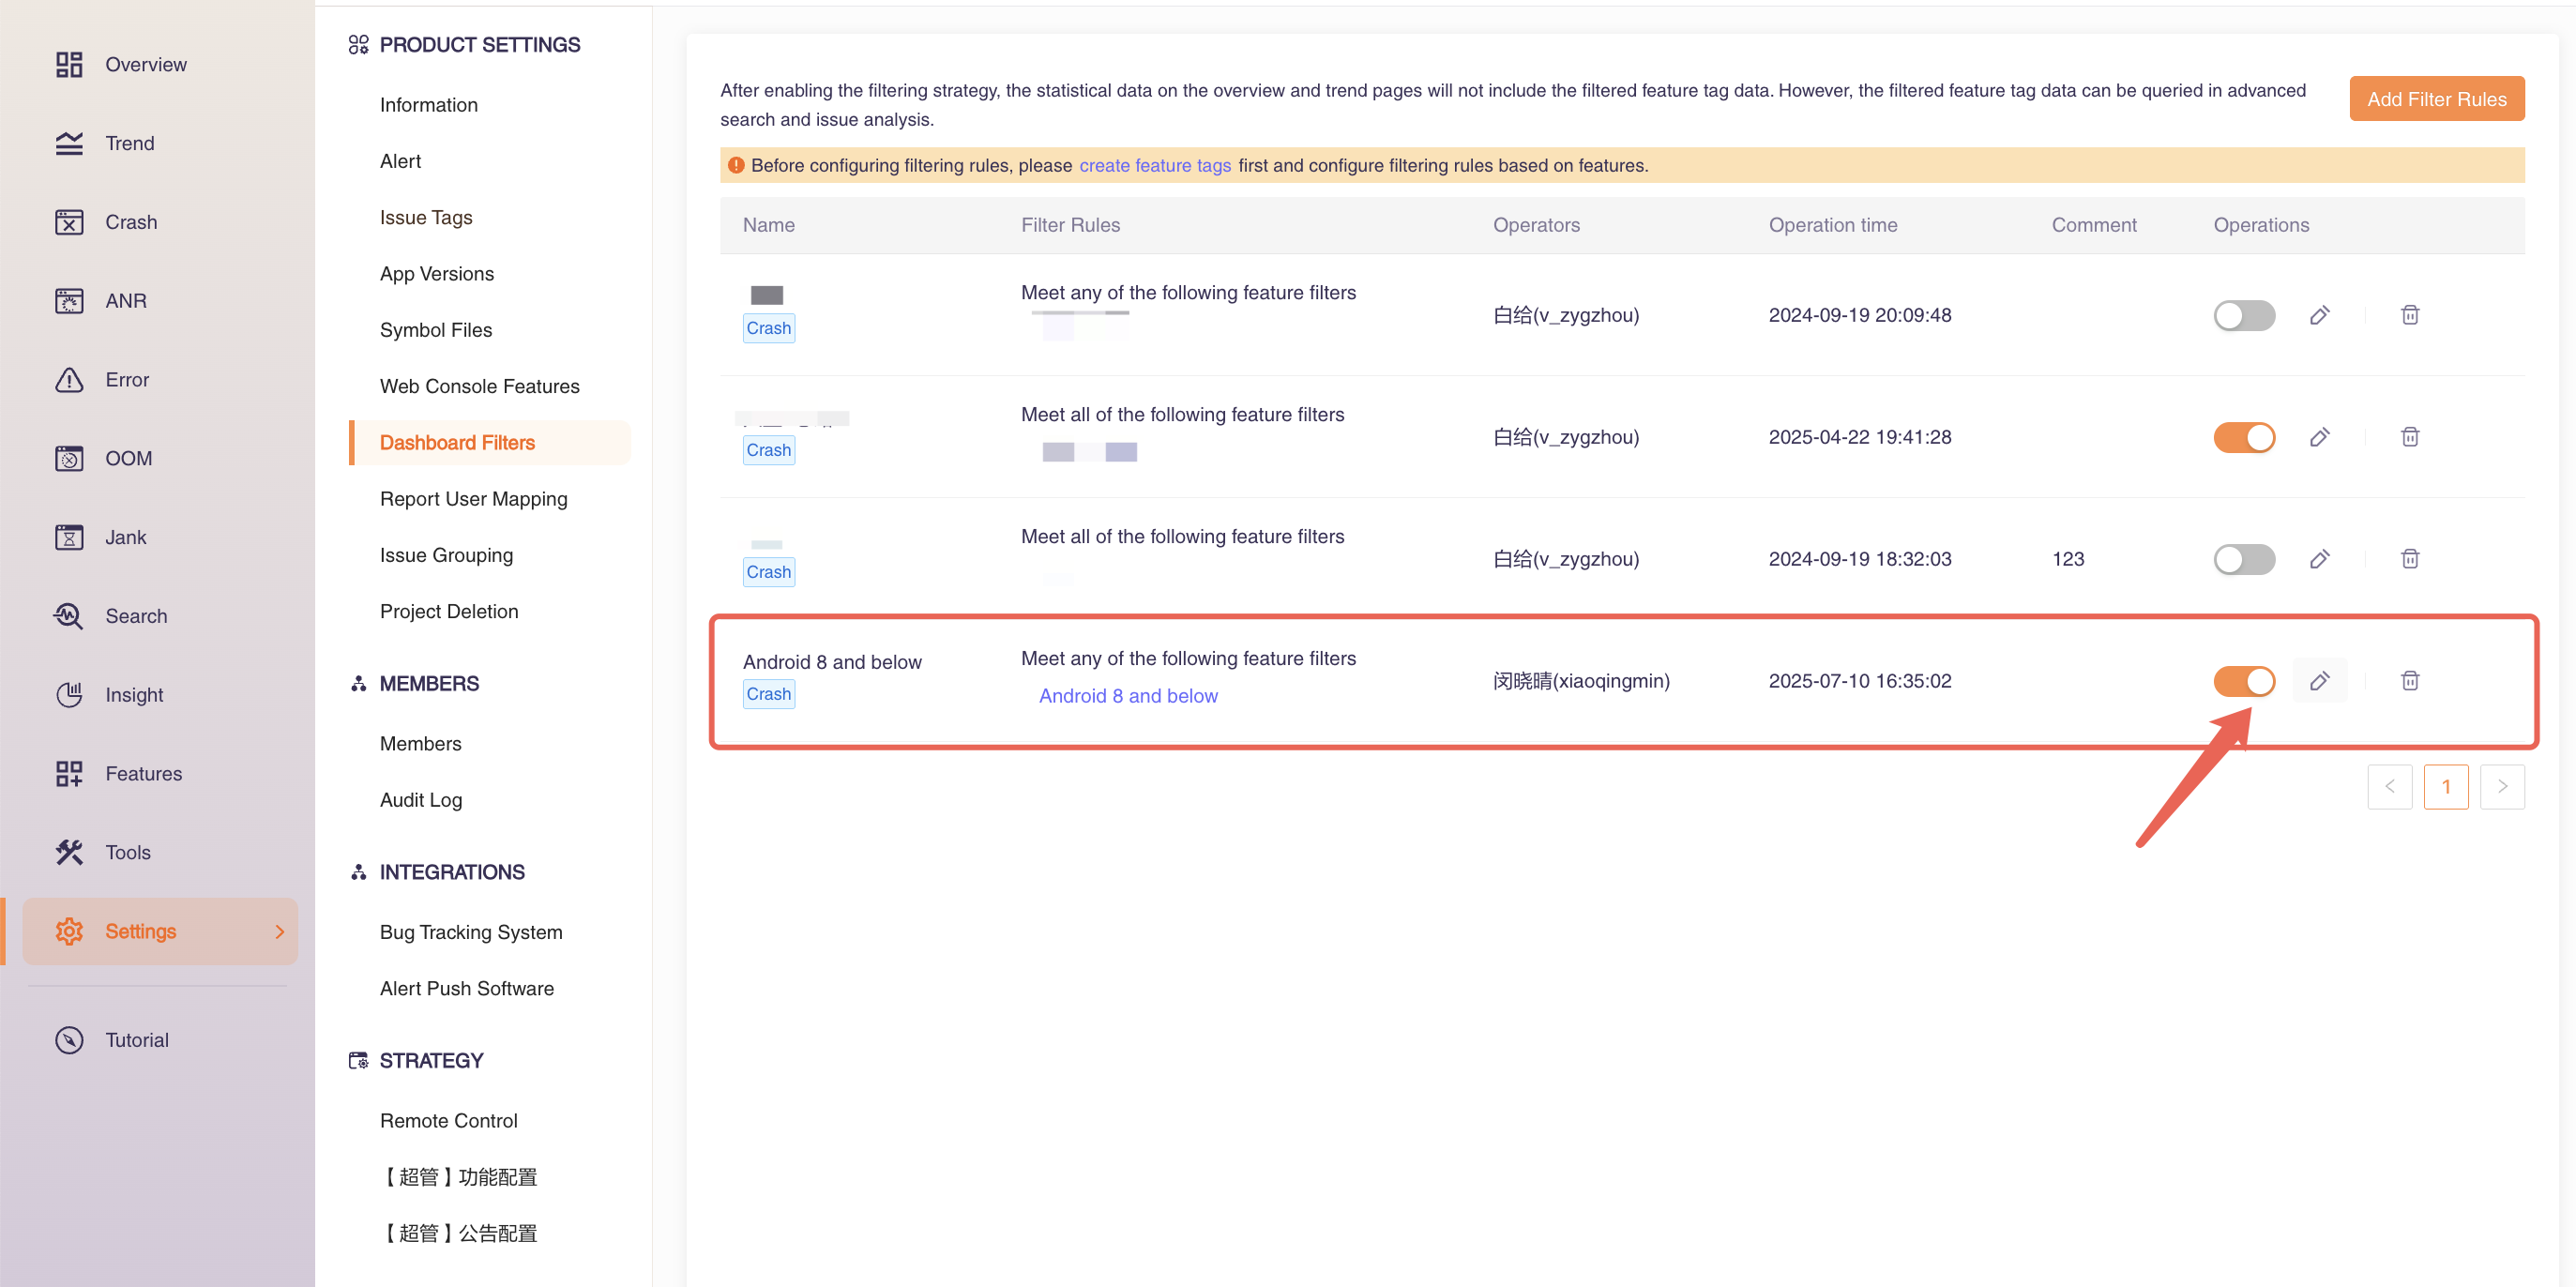
Here you can configure dashboard filtering strategies, using features created in "Features > Feature Rules". This section also displays all configured filtering strategies, including strategy names, filtering rules and so on.
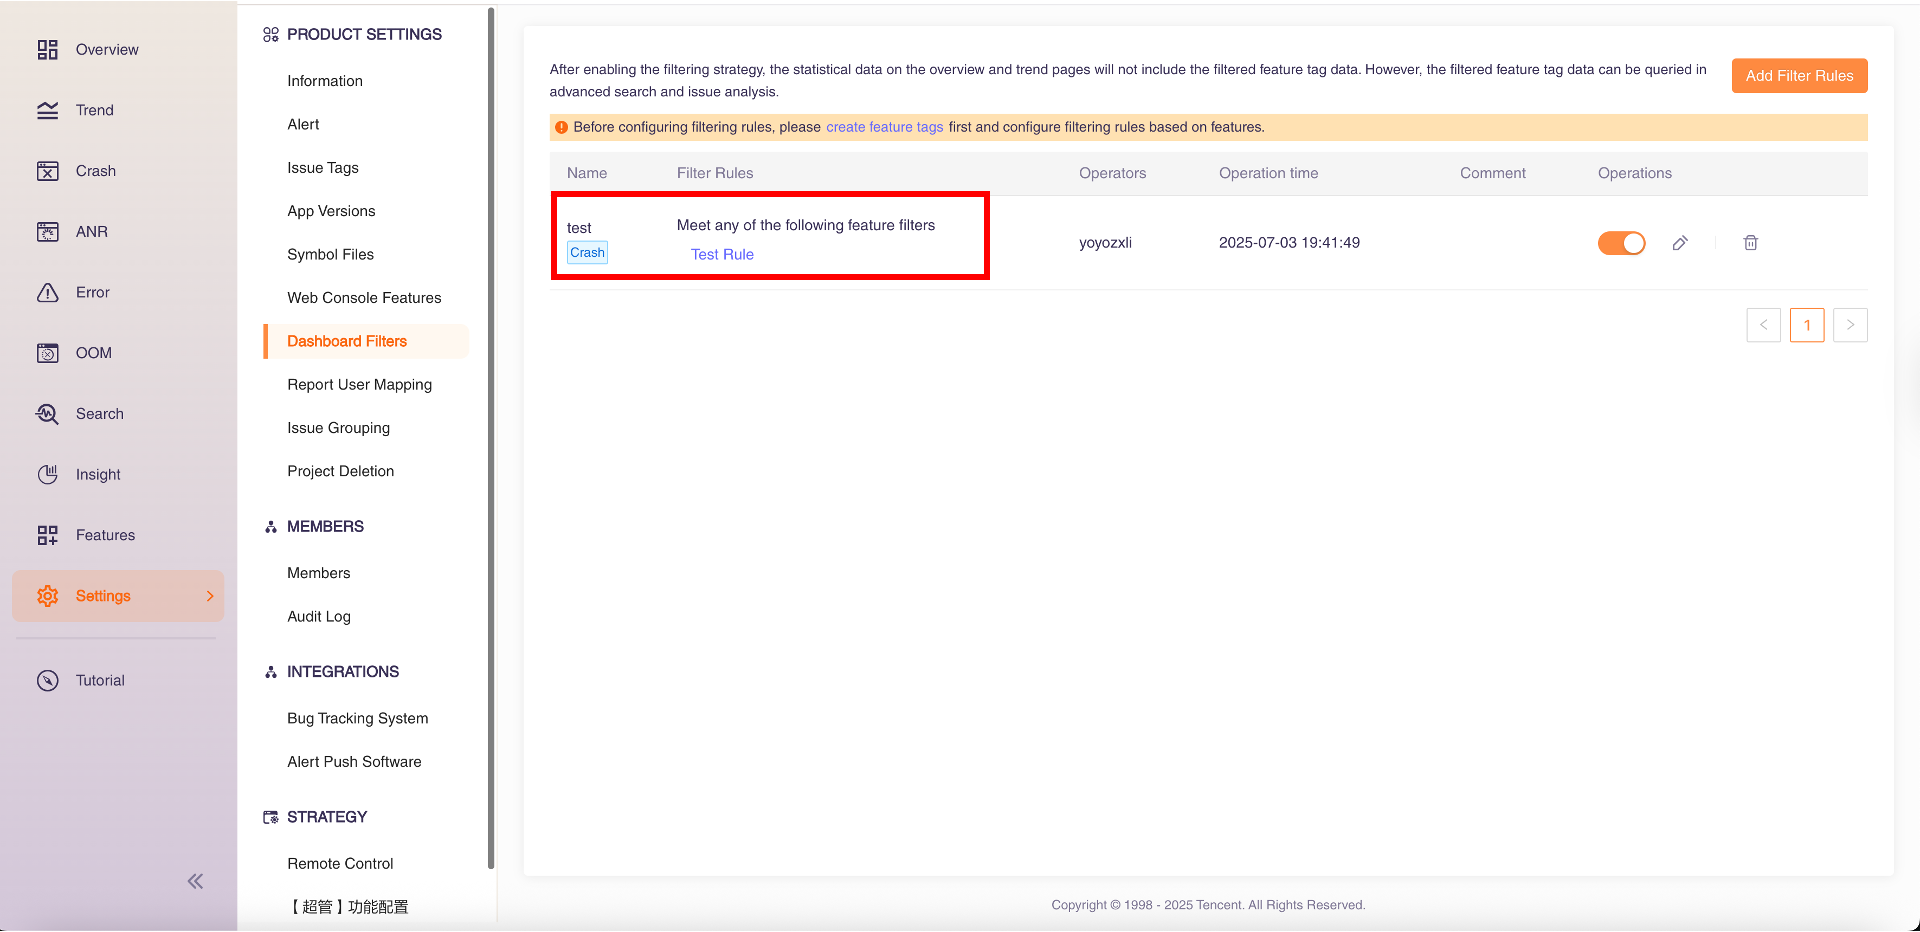
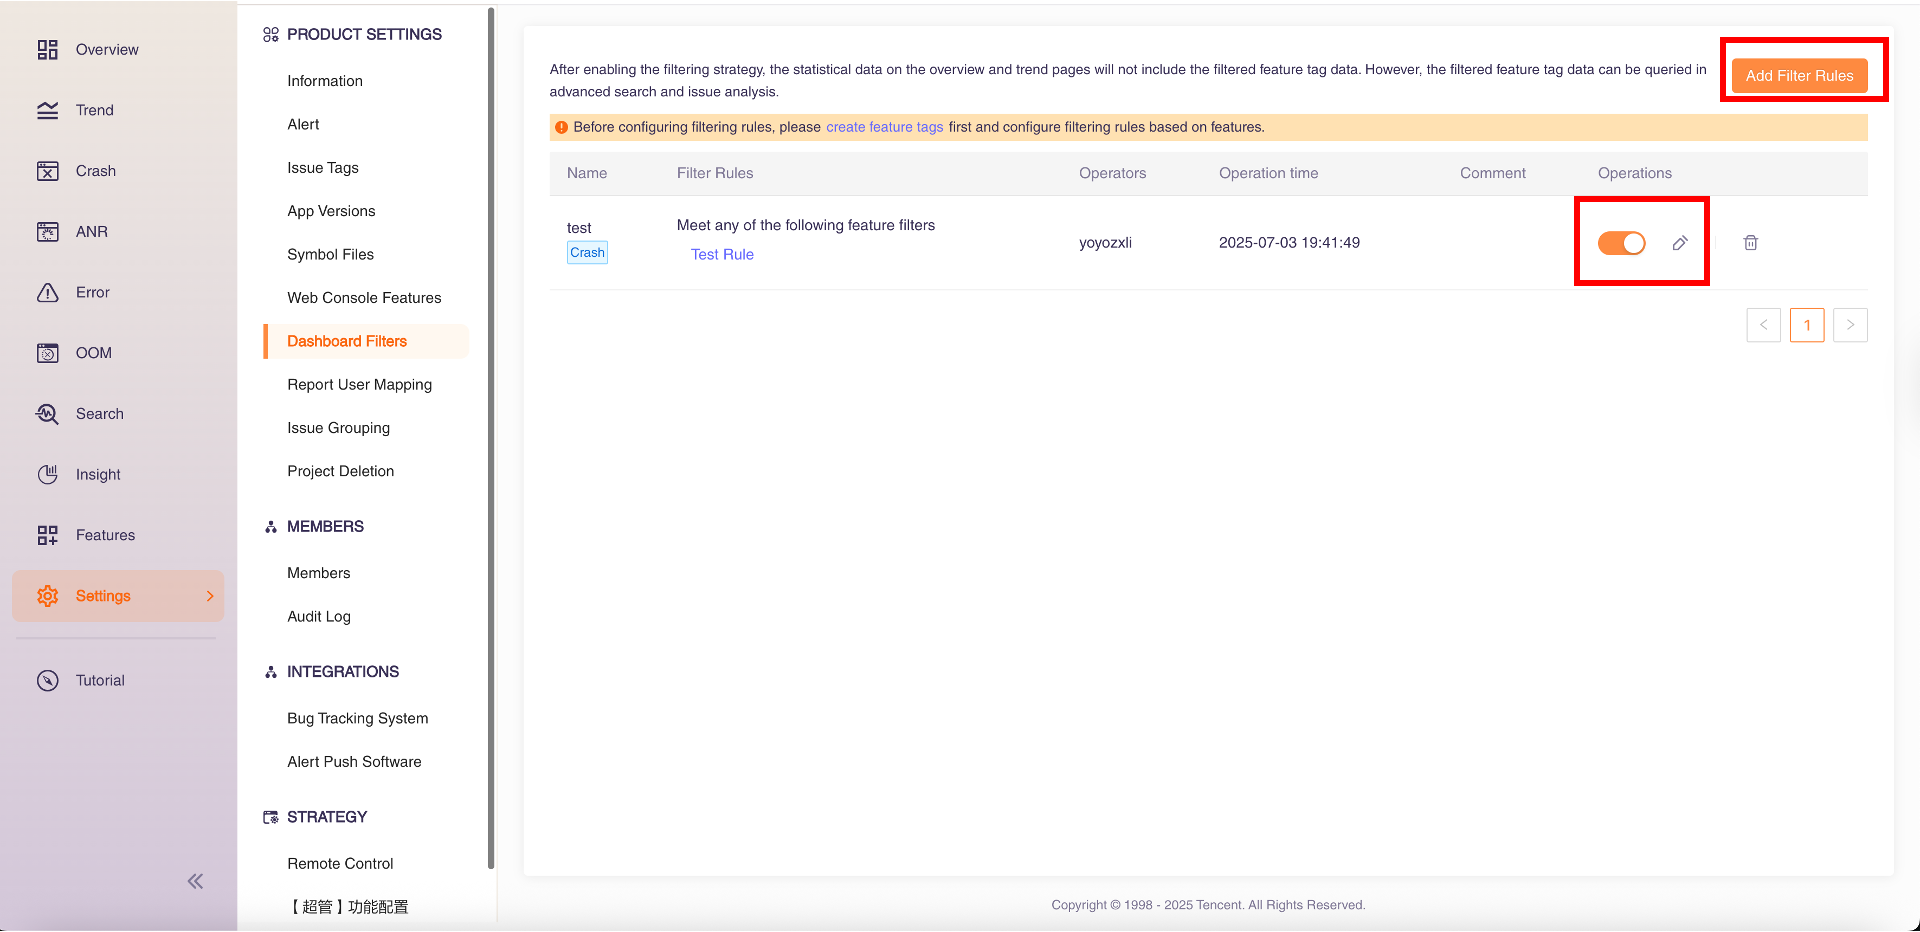
Project administrators can click "Add Filter Rules" to add new rules, "Edit" to modify existing filter rules, or "Enable" to control filter rules activation.
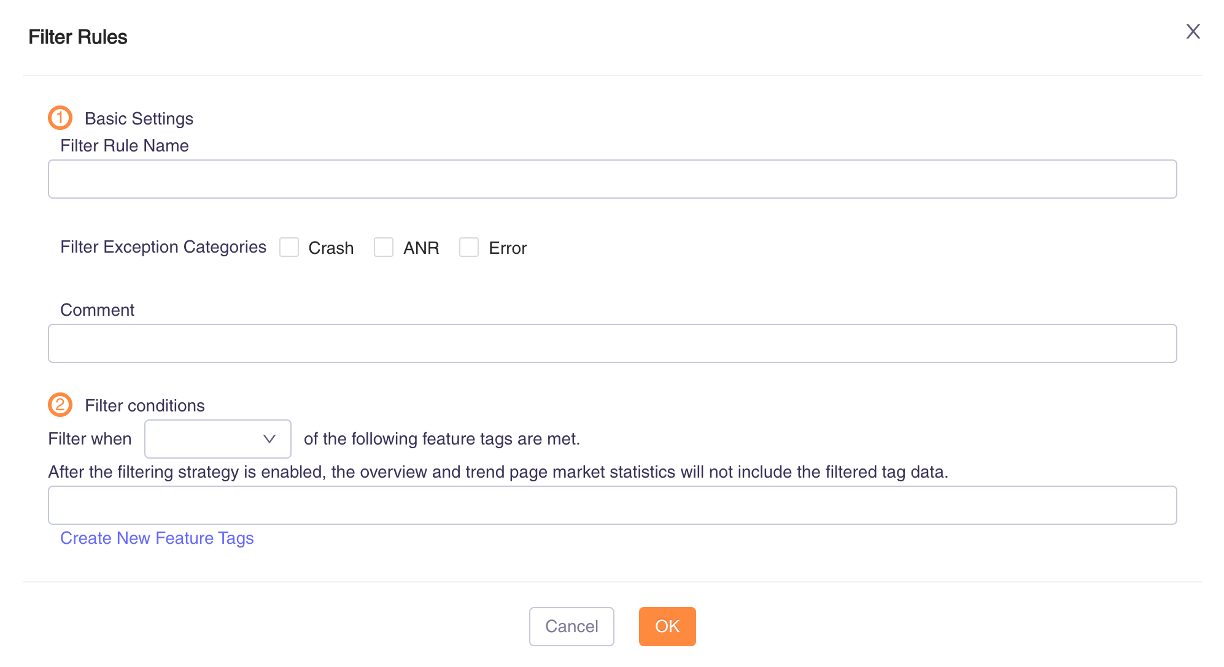
| Configuration Items | Explanation |
|---|---|
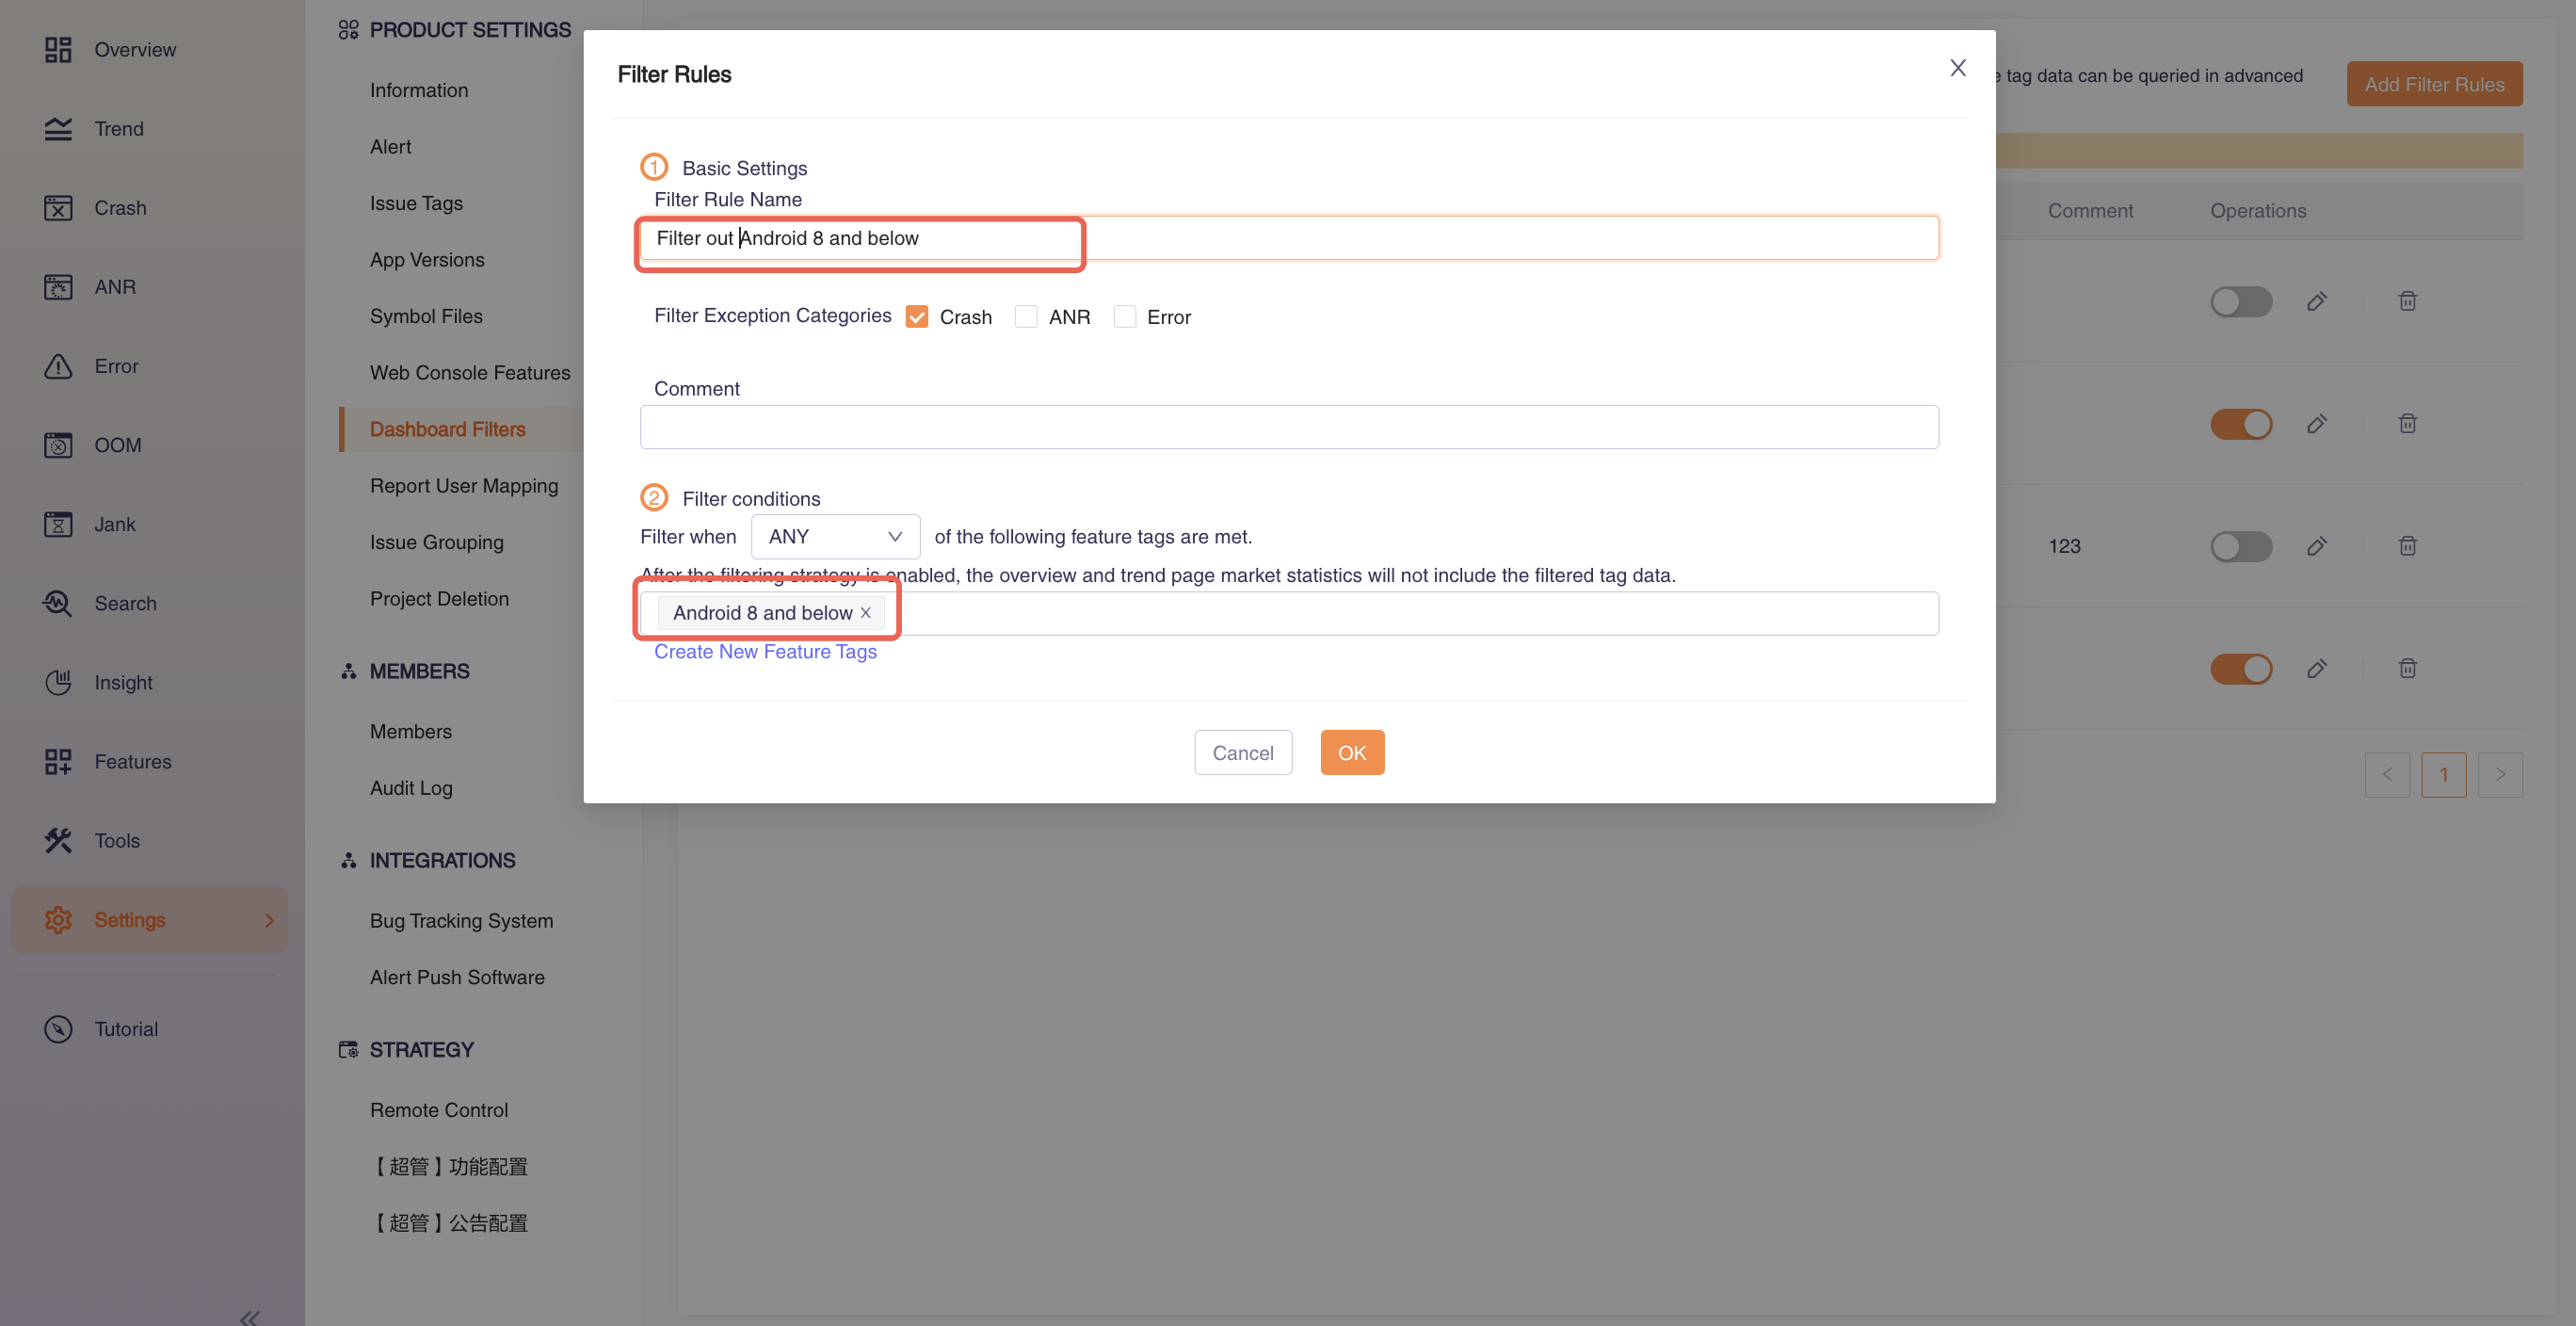
| Filter Rule Name | Name your filter strategy for easier management; |
| Filter Exception Categories | Here you can select which exception categories to filter out with your strategy. Note that these categories do not need to be completely consistent with the "Exception Category" you selected during feature rules configuration, but it need to be included in the “Exception Category” supported by the feature. For example, the feature rule can set the crash and error categories, but the filtering strategy can only ignore the statistics in the crash data, and the error is still counted normally. |
| Filter Conditions | You can configure filtering strategies based on feature rules created in "Features > Feature Rules." Set filtering rules to either "Match Any Feature" or "Match All Features." Alternatively, select "Create New Feature Tags" to create customized feature rules for your strategy. |
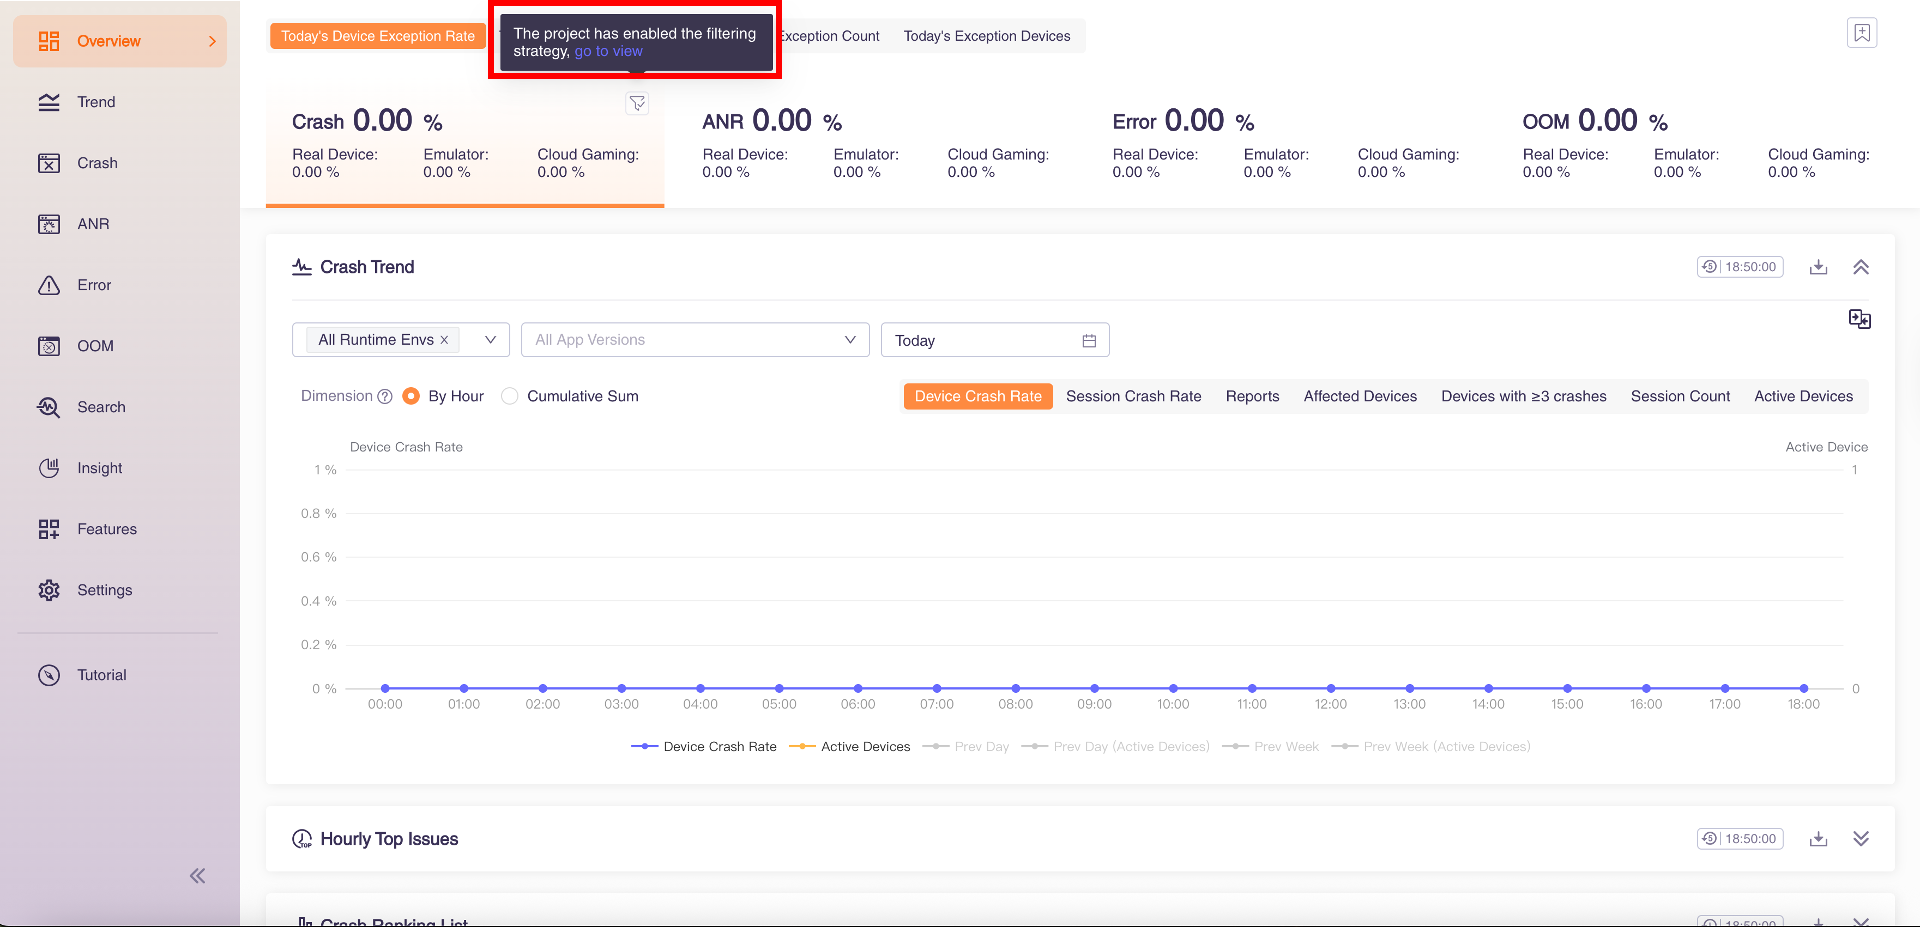
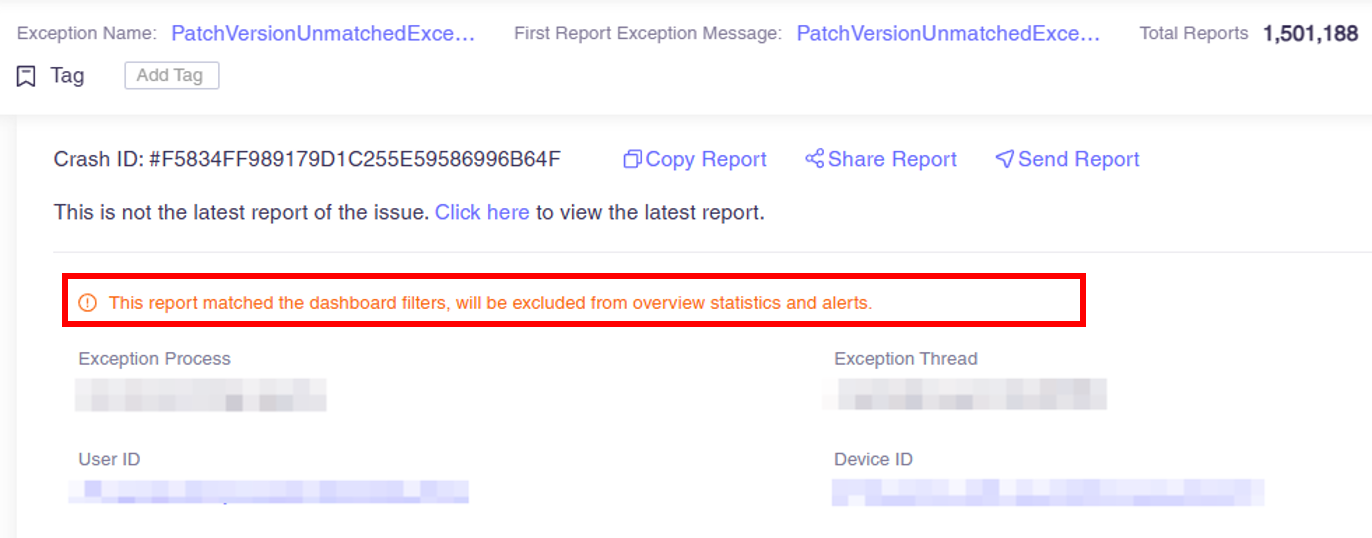
After enabling the filtering strategy, the statistical data on the overview and trend pages will not include the filtered feature tag data. The overview page provides a quick-access link to check whether your project's dashboard filtering strategies are currently active.
In Crash, ANR, and Error sections, the issue list page displays all reported data. On the issue details page, you can view whether the report matched the dashboard filters and be excluded from overview statistics and alerts.
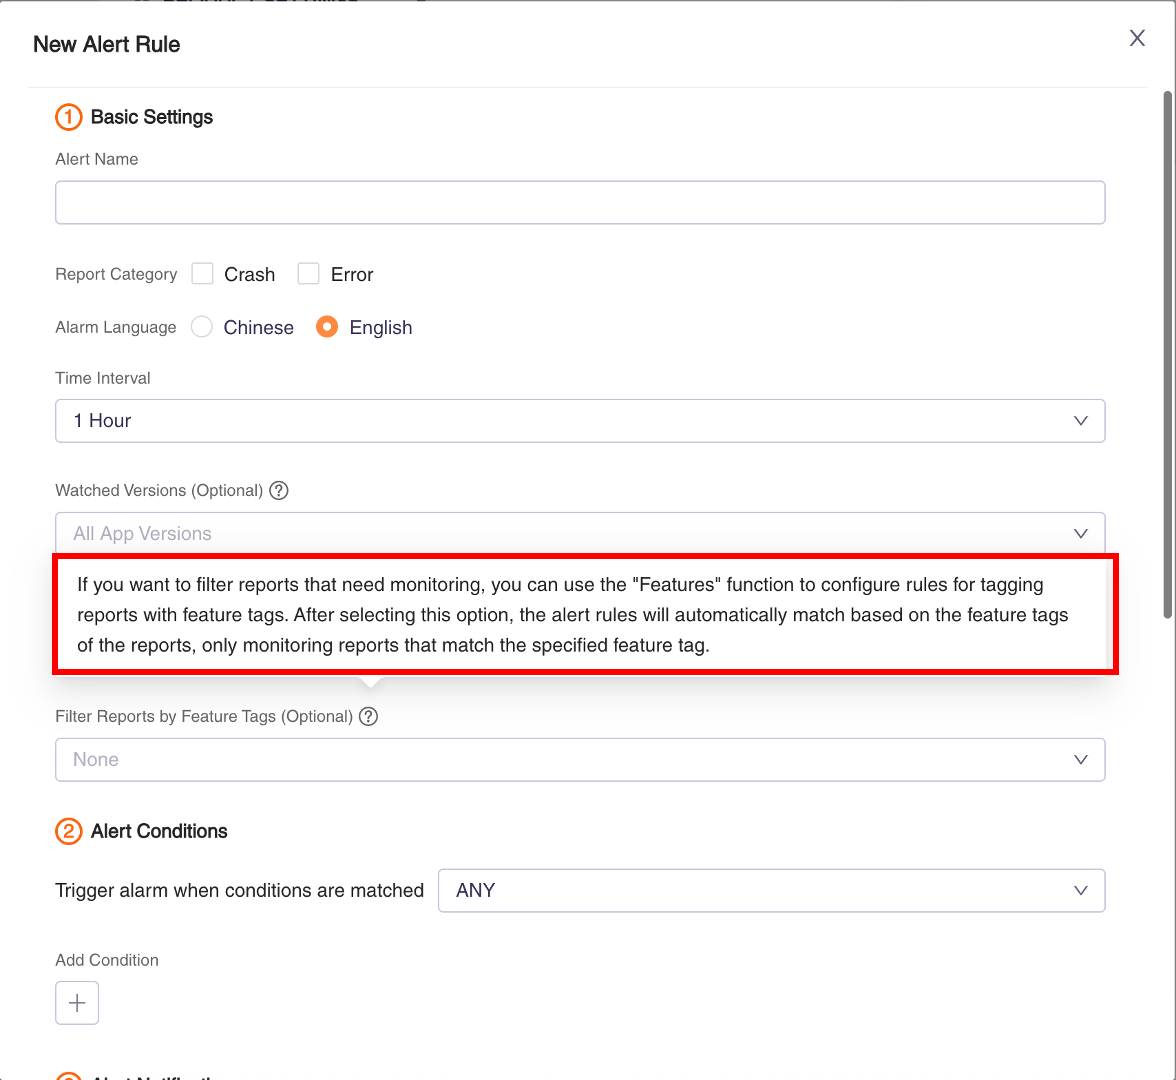
When creating alert rules in "Settings > Product Settings > Alert":
Without selecting "Filter reports with feature tags," alerts won't include filtered feature tag data.
With selecting "Filter reports with feature tags," alerts will only include filtered feature tag data.
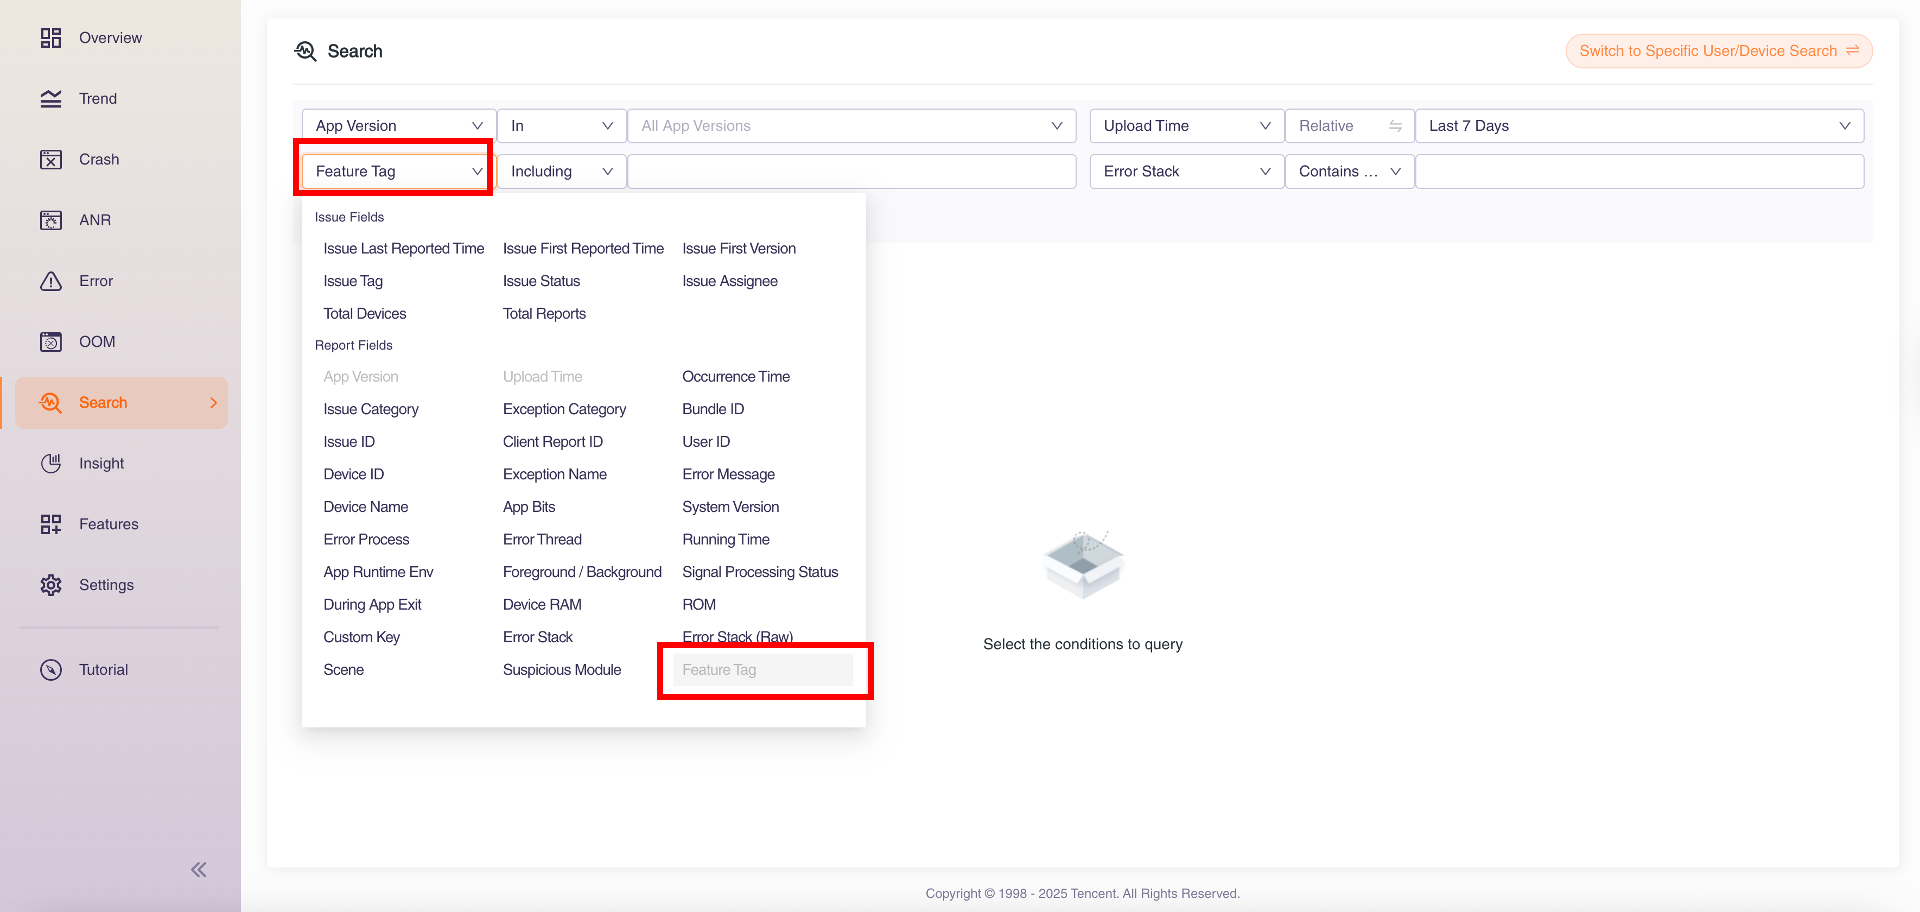
However, the filtered feature tag data can be queried in Search.
4 Use Case
For example, some customers need to ignore exceptions on low-end devices or devices with older system versions, and do not handle crashes issues that occur in the game on these devices. Therefore, it is necessary to add feature tags to these crashes and exclude them from statistics when calculating the crash rate on the overview page.
The specific steps are as follows:
Step 1: Create a feature tag "Android 8 and below"
Step 2: Configure dashboard filter strategy containing this feature tag
Step 3: Activate the filtering strategy
The above 3 steps can meet the user's demand scenarios.